Investors have often used gold tactically in their portfolios, with an aim to help preserve wealth with a relatively liquid asset that can potentially help navigate risk during market corrections, geopolitical stress or persistent dollar weakness. But in addition to gold’s tactical benefits, its function as a core diversifying asset during a variety of business cycles may demonstrate that gold can potentially play a more long-term strategic role.
Gold has the potential to enhance portfolio construction strategies on several fronts — providing broad benefits that can potentially support strategic investment efforts across multiple business cycles. Primary potential benefits include:
- Risk Management
- Capital Appreciation
- Wealth Preservation
Here we show how the key pillars and historical benefits of gold investing can provide potential support for these vital elements of investors’ portfolios.
1. Gold and Risk Management: The Potential Short-term and Strategic Benefits
Managing risks — both short term and unknown — is critical to optimizing portfolio performance. And gold’s historical benefits during a variety of market and business cycles can potentially provide a ballast for portfolios during good times and bad.
Portfolio Diversification
Gold has demonstrated a low and negative historical correlation to many financial indices over time, potentially helping to smooth out volatility and preserve wealth. For example, gold has shown a 0.01 and 0.09 monthly correlation to the S&P 500 Index and Bloomberg US Aggregate Bond Index, respectively, since the 1970s.1 This persistent and historically low correlation to many other financial assets is rooted in gold’s diverse sources of demand — both cyclical and countercyclical — which is illustrated during different phases of a full economic cycle.
Adding an allocation to gold may potentially provide diversification that can help mitigate portfolio drawdowns, increase portfolio efficiency through higher Sharpe Ratios and provide a potential store of value for investors over time.
Managing Market Downturns
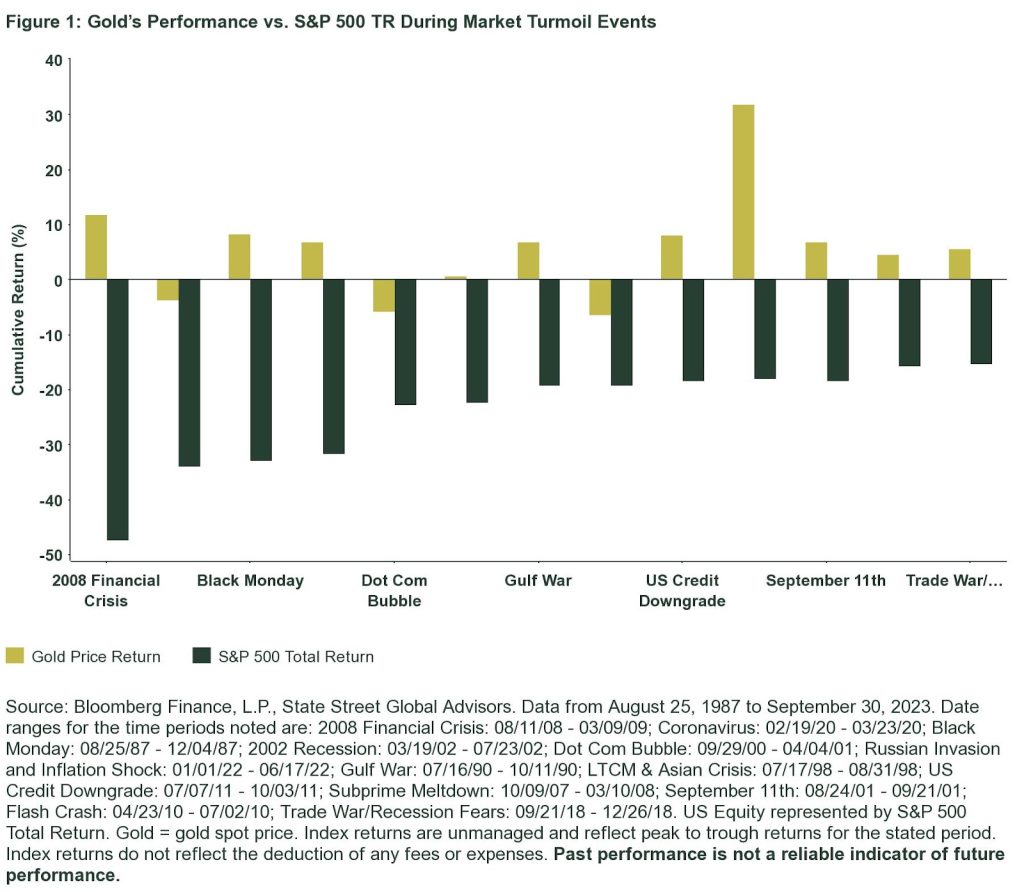
With a reputation as a perceived safe-haven asset,2 gold’s performance has the potential to shine during extreme volatility and market turbulence, growing less correlated to traditional equities and providing a potential ballast for portfolios that can help limit drawdowns.
As 2020 transformed asset markets, investors were faced with constructing portfolios that can weather the low interest rate and risk landscape. Gold’s historic benefits may potentially provide advantages to the modern-day portfolio that can help investors navigate these evolving risks.
Low Correlation to Other Assets and Alternatives
Based on gold’s low correlation to many traditional markets, gold has historically provided positive returns during extreme bouts of volatility and market turmoil — earning it a “perceived safe-haven”2 reputation with some investors.
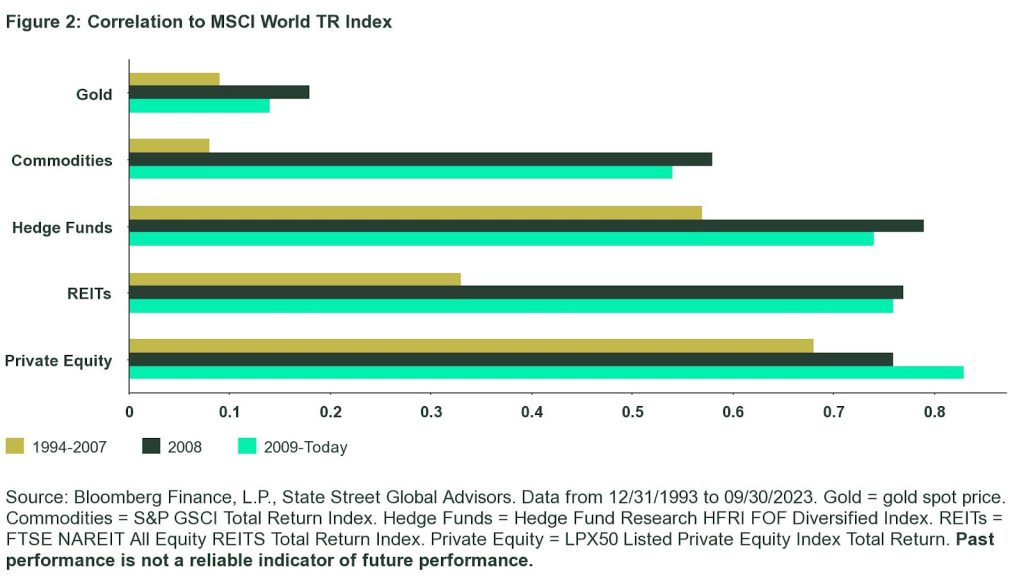
Unlike several other asset classes typically used as portfolio diversifiers, gold has historically been an efficient source of portfolio diversification, with its low correlation historically growing stronger over time, while many real assets have moved in an opposite direction,3 more closely aligning with movements of traditional equities and bonds.
2. Capital Appreciation and Gold’s Potential
Gold may merit consideration in more than just down markets, with its benefits potentially providing investors longer-term and strategic opportunities in terms of capital appreciation. Gold’s diversification and historically uncorrelated returns can potentially help limit episodes of portfolio drawdown, and that can help optimize portfolios by limiting impairments to capital. But gold is not just for managing the downside and may provide the potential opportunity to help investors grow their capital during certain market cycles, with some growth potential of its own.
Historical Long-Term Returns
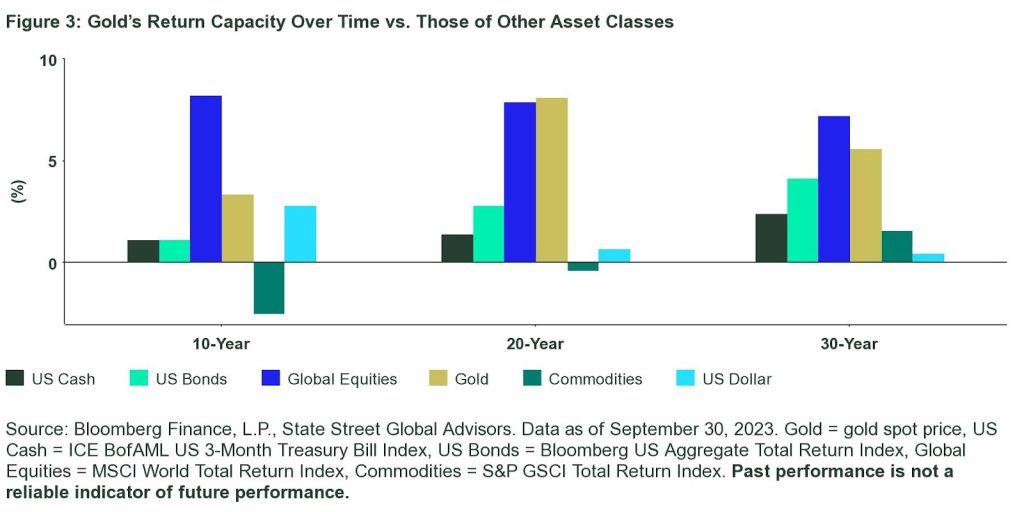
Gold has historically provided competitive long-term returns through a variety of business cycles — good and bad — adding longer-term diversification that can potentially help with optimizing portfolio returns.
Positive Risk-Adjusted Returns
Growing the value of portfolios and optimizing returns across business cycles is essential when constructing portfolios for the long run. Further, a low correlation between the asset classes in a portfolio can also potentially help lower portfolio volatility and therefore, all else being equal, increase diversification that can potentially improve Sharpe Ratios and enhance the overall risk-adjusted return of the portfolio over time.
As illustrated in our research article, Case For Constructing Portfolios with SPDR® Gold Shares (GLD®), we examined how including GLD in a hypothetical multi-asset portfolio – that also includes global stocks, various classes of fixed income, real estate, private equity, and commodities – may improve its risk-return characteristics. We found that holding between 2% and 10% of GLD between January 1, 2005 (GLD’s first year of operation) and the current period may have improved the hypothetical portfolio’s cumulative returns and Sharpe ratio and lowered its maximum drawdown, as compared to a portfolio without any gold-backed investments.
Figure 4: Illustrating the Potential Benefits of a Gold Allocation in a Portfolio – Defining the Hypothetical Portfolios
Asset Class Weightings for Hypothetical Blended Portfolios A, B, C and D
| Asset Class | Weighting (%) | |||
| Portfolio A | Portfolio B | Portfolio C | Portfolio D | |
| Equity | 43 | 42 | 40.5 | 38 |
| Total Equity | 43 | 42 | 40.5 | 38 |
| Government Bonds | 24 | 23 | 21.5 | 19 |
| IG Credit | 15 | 15 | 15 | 15 |
| Inflation-Linked Bonds | 2 | 2 | 2 | 2 |
| HY Bonds | 1 | 1 | 1 | 1 |
| EM Debt | 3 | 3 | 3 | 3 |
| Total Fixed Income | 45 | 44 | 42.5 | 40 |
| Real Estate | 5 | 5 | 5 | 5 |
| Private Equity | 4 | 4 | 4 | 4 |
| Commodities | 3 | 3 | 3 | 3 |
| Gold | 0 | 2 | 5 | 10 |
| Total Alternative | 12 | 14 | 17 | 22 |
| Portfolio Total | 100 | 100 | 100 | 100 |
| Results | ||||
| Annualized Returns (%) | 5.05 | 5.09 | 5.20 | 5.40 |
| Annualized Standard Deviation | 10.55 | 10.40 | 10.30 | 10.18 |
| Sharpe Ratio* | 0.35 | 0.36 | 0.37 | 0.39 |
| Maximum Drawdown (%) | -35.25 | -34.20 | -33.07 | -31.16 |
| Cumulative Return (%) | 151.91 | 153.47 | 158.92 | 167.91 |
*Assumes risk-free rate of Citigroup 3-month T-bills. Past performance is not a reliable indicator of future performance.
Source: State Street Global Advisors, as of September 30, 2023. Equity is represented by MSCI AC World Daily TR Index; Government Bonds is represented by Bloomberg Global Aggregate Government Bond Index TR; IG Credit is represented by Bloomberg Global Aggregate Corporation Bond TR Index; Inflation-Linked Bonds is represented by Bloomberg World Inflation Linked Bond TR Index, HY Bonds is represented by Bloomberg Global Corporate High Yield Bond TR Index; EM Debt is represented by Bloomberg Emerging Markets USD Aggregate Bond TR Index; Real Estate is represented by Global Property Research General TR Index, Private Equity is represented by LPX Composite Listed Private Equity TR Index; Commodities is represented by Bloomberg Commodity Index TR; Gold is represented by SPDR® Gold Shares (GLD®).
The asset allocation scenario is for hypothetical purposes only and is not intended to represent a specific asset allocation strategy or recommend a particular allocation. Each investor’s situation is unique and asset allocation decisions should be based on an investor’s risk tolerance, time horizon and financial situation. It is not possible to invest directly in an index. The impact of adding GLD to an investor’s portfolio will vary based upon an investor’s asset allocation decisions and market performance, among other things. Index returns are unmanaged and do not reflect the deduction of any fees or expenses. Index returns reflect all items of income, gain and loss and the reinvestment of dividends and other income. Returns do not represent those of a specific product but were achieved by mathematically combining the actual performance data of the constituents as listed in the table above. Performance of the hypothetical blended portfolio assumes no transaction and rebalancing costs, so actual results will differ. Performance of SPDR® Gold Trust (GLD®) reflects annual expense ratio of 0.40 percent. All data based on monthly measures of performance. Investment return and principal value will fluctuate, so you may have a gain or loss when shares are sold. Current performance may be higher or lower than that quoted. Visit ssga.com for most-recent month-end performance. Additional information regarding the Hypothetical Portfolio Methodology computation can be found in the Glossary.
To read the full report, you can access the case study here.
Figure 5: GLD® Standard Performance Information as of September 30, 2023
| 1 Month (%) | QTD (%) | YTD (%) | 1 Year (%) | 3 Year (%) | 5 Year (%) | 10 Year (%) | Since Inception (%) | |
| NAV | -3.73 | -2.28 | 2.90 | 11.44 | -0.69 | 9.08 | 3.08 | 7.51 |
| Market Value | -4.76 | -3.83 | 1.07 | 10.85 | -1.08 | 8.74 | 2.95 | 7.37 |
| LBMA Gold Price PM | -3.70 | -2.18 | 3.13 | 11.89 | -0.29 | 9.51 | 3.49 | 7.94 |
Inception Date: November 18, 2004. Source: ssga.com. Past performance is not a reliable indicator of future performance. Investment return and principal value will fluctuate, so you may have a gain or loss when shares are sold. Current performance may be higher or lower than that quoted. All results are historical and assume the reinvestment of dividends and capital gains. Visit ssga.com for most recent month-end performance. Performance returns for periods of less than one year are not annualized. The market price used to calculate the Market Value return is the midpoint between the highest bid and the lowest offer on the exchange on which the shares of the Fund are listed for trading as of the time that the Fund’s NAV is calculated. If you trade your shares at another time, your return may differ. Gross and Net Expense Ratio: 0.40%. The gross expense ratio is the fund’s total annual operating expense ratio. It is gross of any fee waivers or expense reimbursements. It can be found in the fund’s most recent prospectus.
3. Preserving Wealth: More Potential Strategic Benefits of Gold’s Diversification
Based on gold’s historical diversification and positive risk-adjusted returns during market turbulence, it has a track record of potentially helping to temper short-term volatility and limit drawdowns.
But an allocation to gold may support preserving wealth on a longer-term basis too, with its historical positive longer-term risk-adjusted returns during a variety of business cycles helping investors weather unforeseen risks and capital impairments that can erode a portfolio’s value over time. See the above chart for gold’s longer-term performance and how it can potentially influence portfolio construction during a variety of business cycles over time.
Deep Liquidity
Gold’s liquidity may help with wealth preservation, providing investors a relatively deep and liquid trading market that may be a key benefit of holding gold strategically. With a historical trading volume on par with major debt, currency, and equity markets, the estimated average daily turnover of gold is more than US $132 billion, which is equivalent to US $33 trillion a year.4
And even during turbulent markets, like those experienced during March 2020, gold market liquidity has stood the test of time, with gold trading volumes hitting US $237 billion in March during the initial COVID-19 lockdown,5 providing investors ready access to a liquid trading market — or access to cash — when many other assets were declining in value.
Historical Store of Value
Longer term, gold can potentially provide a unique store of value for investors, helping to preserve purchasing power over time. Gold has kept up with rising prices by historically providing positive returns during periods of rising inflation, particularly during environments of extreme inflation.6
Additionally, gold has showcased its ability to hedge against currency debasement by historically maintaining a negative correlation to the US dollar.7 Taken together, gold’s ability to keep up with prices, in conjunction with currency depreciation, may potentially help investors maintain purchasing power and preserve value against inflationary pressures.
Gold for the Long Term
Investors may consider thinking about gold not just as a tactical asset to be used in times of crisis, but instead, as a long-term, strategic investment with unique and diverse potential benefits. Learn about the primary benefits gold may offer portfolios relative to other major asset classes, as well as its distinct contribution to portfolio strategy over the long run in Invest in Gold: A Portfolio Diversifier With Staying Power.
This post first appeared on October 18th, 2023 on the State Street Global Advisors’ blog
PHOTO CREDIT: https://www.shutterstock.com/g/macrowildlife
Via SHUTTERSTOCK
Disclosures
Information Classification: General Access
Important Risk Information
Investing involves risk including the risk of loss of principal.
This communication is not intended to be an investment recommendation or investment advice and should not be relied upon as such.
The whole or any part of this work may not be reproduced, copied or transmitted or any of its contents disclosed to third parties without SSGA’s express written consent.
All information is from SSGA unless otherwise noted and has been obtained from sources believed to be reliable, but its accuracy is not guaranteed. There is no representation or warranty as to the current accuracy, reliability or completeness of, nor liability for, decisions based on such information and it should not be relied on as such.
Frequent trading of ETFs could significantly increase commissions and other costs such that they may offset any savings from low fees or costs.
Diversification does not ensure a profit or guarantee against loss.
The trademarks and service marks referenced herein are the property of their respective owners. Third party data providers make no warranties or representations of any kind relating to the accuracy, completeness or timeliness of the data and have no liability for damages of any kind relating to the use of such data.
Investing involves risk, and you could lose money on an investment in each of SPDR® Gold Shares Trust (“GLD®” or “GLD”) and SPDR® Gold MiniShares® Trust (“GLDM®” or “GLDM”), a series of the World Gold Trust (together, the “Funds”).
Commodities and commodity-index linked securities may be affected by changes in overall market movements, changes in interest rates, and other factors such as weather, disease, embargoes, or political and regulatory developments, as well as trading activity of speculators and arbitrageurs in the underlying commodities.
Investing in commodities entails significant risk and is not appropriate for all investors.
Important Information Relating to GLD® and GLDM®:
GLD and the World Gold Trust have each filed a registration statement (including a prospectus) with the Securities and Exchange Commission (“SEC”) for GLD and GLDM, respectively. Before you invest, you should read the prospectus in the registration statement and other documents each Fund has filed with the SEC for more complete information about each Fund and these offerings. Please see each Fund’s prospectus for a detailed discussion of the risks of investing in each Fund’s shares. The GLD prospectus is available by clicking here, and the GLDM prospectus is available by clicking here. You may get these documents for free by visiting EDGAR on the SEC website at sec.gov or by visiting spdrgoldshares.com. Alternatively, the Funds or any authorized participant will arrange to send you the prospectus if you request it by calling 866.320.4053.
None of the Funds is an investment company registered under the Investment Company Act of 1940 (the “1940 Act”). As a result, shareholders of each Fund do not have the protections associated with ownership of shares in an investment company registered under the 1940 Act. GLD and GLDM are not subject to regulation under the Commodity Exchange Act of 1936 (the “CEA”). As a result, shareholders of each of GLD and GLDM do not have the protections afforded by the CEA.
Shares of each Fund trade like stocks, are subject to investment risk and will fluctuate in market value.
The values of GLD shares and GLDM shares relate directly to the value of the gold held by each Fund (less its expenses), respectively. Fluctuations in the price of gold could materially and adversely affect an investment in the shares. The price received upon the sale of the shares, which trade at market price, may be more or less than the value of the gold represented by them.
None of the Funds generate any income, and as each Fund regularly sells gold to pay for its ongoing expenses, the amount of gold represented by each Fund share will decline over time to that extent.
The World Gold Council name and logo are a registered trademark and used with the permission of the World Gold Council pursuant to a license agreement. The World Gold Council is not responsible for the content of, and is not liable for the use of or reliance on, this material. World Gold Council is an affiliate of the Sponsor of each of GLD and GLDM.
MiniShares® is a registered trademark of WGC USA Asset Management Company, LLC used with the permission of WGC USA Asset Management Company, LLC. GLD® and GLDM® are registered trademarks of World Gold Trust Services, LLC used with the permission of World Gold Trust Services, LLC.
For more information, please contact the Marketing Agent for GLD and GLDM: State Street Global Advisors Funds Distributors, LLC, One Iron Street, Boston, MA, 02210; T: +1 866 320 4053 spdrgoldshares.com
Footnotes:
1 Bloomberg Finance, L.P., & State Street Global Advisors; LBMA Gold Price PM ($/oz) has demonstrated a 0.01 and 0.09 monthly correlation to the S&P 500 Index and Bloomberg US Aggregate Bond Index, respectively. S&P 500 correlation is from 8/31/1971 to 09/30/2023 and Bloomberg US Aggregate Bond Index correlation is from 3/31/1976 to 09/30/2023 due to data availability. The correlation coefficient measures the strength and direction of a linear relationship between two variables. It measures the degree to which the deviation of one variable from its mean is related to that of a different variable from its respective mean, with 0 being uncorrelated and 1 being perfectly correlated.
2 Assets may be considered “safe havens” based on investor perception that an asset’s value will hold steady or climb even as the value of other investments drops during times of economic stress. Perceived safe-haven assets are not guaranteed to maintain value at any time.
3 Bloomberg Finance, L.P., State Street Global Advisors. Data from 12/31/93 to 09/30/2023. Gold = gold spot price. Commodities = S&P GSCI Total Return Index, REITs = FTSE NAREIT All Equity REITS Total Return Index. Past performance is not a reliable indicator of future performance.
4 World Gold Council, Bloomberg, Bank for International Settlements, London Bullion Market Association. Data as of December 31, 2022. Estimates based on clearing statistics published by the LBMA, LBMA-i and non-LBMA-i OT, COMEX, SHFE, SGE, LME precious, Dubai Gold & Commodities Exchange, ICE Futures, US Metals, Borsa Istanbul, Bursa Malaysia, Moscow Exchange, and Tokyo Commodity Exchange.
5 World Gold Council, Bloomberg, Bank for International Settlements, London Bullion Market Association. Data as of December 31, 2022. Estimates based on clearing statistics published by the LBMA, LBMA-i and non-LBMA-i OT (estimates represent daily averages in US$ billion for Q2’2020), COMEX, SHFE, SGE, LME precious, Dubai Gold & Commodities Exchange, ICE Futures, US Metals, Borsa Istanbul, Bursa Malaysia, Moscow Exchange, and Tokyo Commodity Exchange.
6 Bloomberg Finance L.P., & State Street Global Advisors. Gold has increased by an average annual rate of 10.6% when price inflation has been running above 5% per year from August 31, 1971 to September 30, 2023.
7 Bloomberg Finance L.P., & State Street Global Advisors. LBMA Gold Price PM ($/oz) has demonstrated a -0.39 monthly correlation to the US Dollar Index from August 31, 1971 to September 30, 2023.