By Alex Roll
Amid rising yields and ongoing macro uncertainty, August commenced for global markets on a somewhat unstable note, historically aligning with the trend of a seasonally weaker market performance in September and October. The current landscape is particularly marked by contraction in manufacturing activity and dwindling consumer confidence across Europe and China.
However, the environment appears brighter in the U.S. Continuing positive developments on inflation, a resilient consumer, and continued strong labor market could shed some optimism for the market’s trajectory for the remainder of 2H 2023. Equities may find support from a strong earnings season, increasing estimates and a solid U.S. Q2 GDP print coming in at 2.1%.1 Real consumption expenditures in July rose 0.6% which was the fastest increase since the 1.3% surge in January 2023.2 Further investment grade credit spreads remain supportive and fell to an 18-month low.3 Robust structural tailwinds driven by a strong capex cycle and advancements in technological innovation continue to provide tailwinds in certain thematics.
The recent selloff owes to higher yields, aligning with the “higher for longer” scenario in which strong economic data suggest yields could stay elevated longer than expected, rather than a new development. The Fed discussions at Jackson Hole confirmed this stance whilst Fed Chair Jerome Powell voiced that the Fed is weighing balancing the dynamics of achieving its 2% inflation target with the need to monitor incoming data and assess potential risks of overtightening.
Investment strategies highlighted this month:
- U.S. Industrial Renaissance – Reshoring, legislative support and substantial investment are reviving U.S. Industrial Production, stimulating economic growth, and spurring job creation.
- Cloud-Powered AI Transformation – The marriage of cloud, AI, and IoT is driving industry transformation from healthcare to software for the digital era.
- Navigating Shopping Trends in the Digital Age – Evolving spending patterns driven by digital-savvy generations, social commerce, and cross-border trends are propelling the e-commerce landscape.
U.S. Industrial Renaissance – Reshoring, legislative support and substantial investment are reviving U.S. Industrial Production, stimulating economic growth and spurring job creation.
U.S. industrial production growth stagnated for the past two decades due to globalization and low-cost manufacturing in China. However, we are now witnessing a transformative shift due to the resurgence of reshoring and the localization of supply chains as part of a strategic response to geopolitical tensions. Further public and private investment play a crucial role in fueling economic growth, job creation, and wage growth.
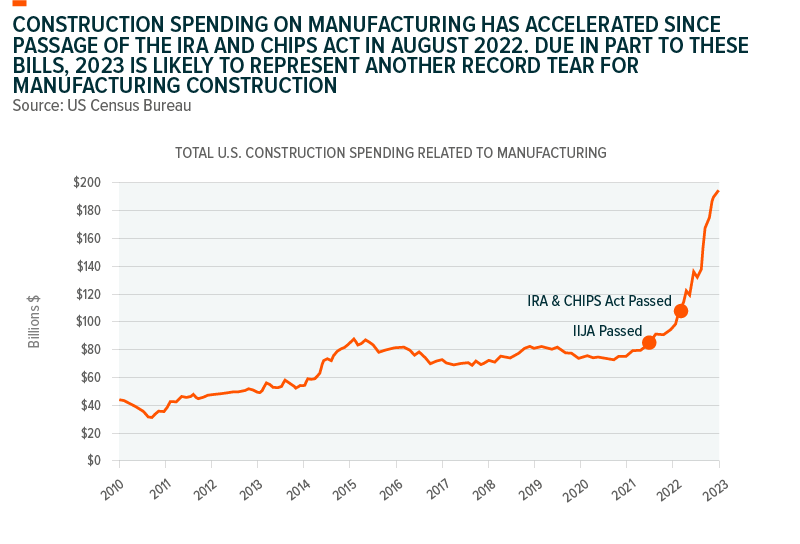
At the legislative forefront, the Infrastructure and Jobs Act (IIJA), Inflation Reduction Act (IRA), CHIPS and Science Act (CHIPS) serve as strategic enablers, designed to reinforce U.S. competitiveness across emerging industries such as renewable energy, electric vehicles, and semiconductors. The IIJA, enacted in November 2021, earmarks a substantial $1.2 trillion, channeling $550 billion into visionary projects spanning modern infrastructure sectors.4 Since the passage of these acts, manufacturing construction spending has surged, spotlighting a potential landmark year in 2023 with monthly outlays nearing $200 billion. This drive is already evident in the remarkable $108 billion spent on construction in 2022, underscoring a commitment to fortify U.S. manufacturing capabilities.5 Further, Q2 2023 real GDP growth came in at a better than expected 2.4% with 0.4% derived from private investment in manufacturing structures, its largest contribution to real GDP growth in more than 40 years.6
Infrastructure development companies are expected to benefit from manufacturing growth, including construction and engineering services, key raw materials suppliers, transportation providers, and manufacturers of large-scale equipment. The guidance provided by U.S. infrastructure companies remains consistent in projecting substantial benefits from the IIJA, IRA and Chips acts to materialize around late 2023. A 2021 survey found that 82% of U.S. executive expressed positive sentiment toward reshoring efforts.7 During August the White House issued final guidance on Build America, Buy America (BABA) regulations as part of the IIJA, that is meant to boost the amount of domestically sourced materials used for federally funded infrastructure projects. To qualify as American made under BABA, a product must be manufactured in the US, with at least 55% of the cost of components fabricated domestically.8 The guidelines could represent a small additional tailwind for the domestically focused material suppliers.
The capex cycle remains strong in the U.S. and structural tailwinds and supportive legislations enacted may reduce the cyclical nature of this capex cycle even in the event of a global downturn. The Q2 earnings season showed that capex spending for S&P 500 companies was up 9% YoY in Q2, Bank of America reported.9 Further thus far, $300bn of public and $300bn of private investment have gone into U.S. infrastructure representing the equivalent of 50% of the $1.2 trillion from the IIJA bill with projects being approved. In our view they are not fully represented within the sales and earnings estimates from Wall Street. A basket of companies benefitting from the U.S. Infrastructure boom as represented by the Indxx U.S. Infrastructure Development v2 Index continues to only be priced at a 0.4% 12-month forward consensus sales growth.10
The convergence of reshoring, automation, and increasing GDP growth in the U.S. has the potential to update various segments, including materials and construction companies within the industrial space. As corporate and public commitments align, U.S. industrial production looks set to remain a compelling and consistent story amid choppy markets.
Cloud-Powered AI Transformation – The marriage of cloud, AI, and IoT is driving industry transformation from healthcare to software for the digital era.
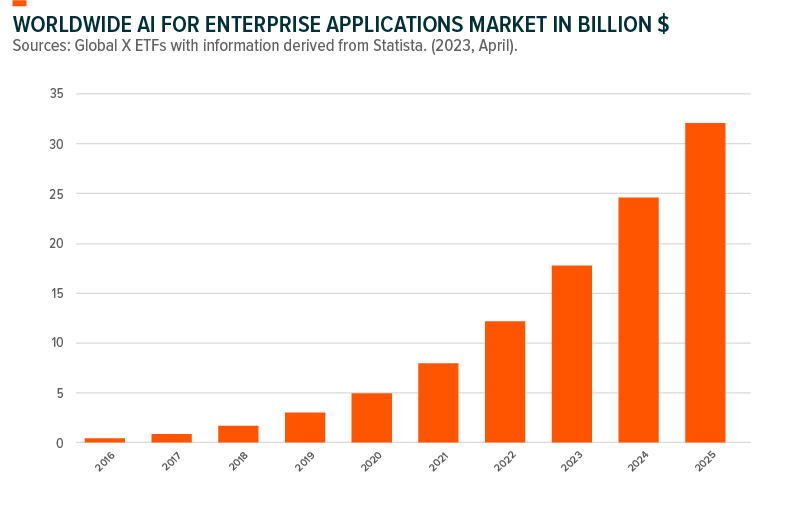
Cloud companies are poised to become the distribution network for artificial intelligence, extending their reach into sectors like biotech, general health care, software and many more industries. Cloud computing drives business progress through scalable, cost-effective solutions for diverse IT needs, propelling emerging technologies like Artificial Intelligence (AI) and the Internet-of-Things (IOT). Organizations continue to default to cloud-based services when upgrading or purchasing new technical capabilities. The number one business driver for cloud computing continues to be disaster recovery and business continuity, while data privacy and security challenges are one of the top obstacles to implementing a cloud strategy. Gartner, a technological consulting firm, estimates that by 2024, AI-driven data management will likely reduce the need for IT experts by around 30%.11 The generative AI market is expanding due to the integration of AI systems across various industries, metaverse virtual world creation, and workforce updates. The rise in demand for machine learning and deep learning offers growth opportunities propelled by tech giants such as Microsoft, Google, Apple, and IBM.12
In June 2022, Amazon Web Services enhanced its cloud platform for efficient coding, dataset training, and AI integration. Further AWS announced in July 2023 a new AI tool to help health care providers summarize doctor visits and software that lets companies create their own chatbots.13 During March 2023 Microsoft released the API of ChatGPT and Whisper models, offering cutting-edge language and speech-to-text capabilities to developers.14
Despite the strong market rally in the technology sector this year, the U.S. valuation premium appears justified given the country is at the forefront of the AI race and remains dominant in technology. Further earnings and revenue generation have been strong within this space and remain positive based on guidance delivered in the U.S. The U.S. leads by a wide margin in terms of newly funded AI companies with 542 in 2022 and 4,643 over the past decade, nearly 3.5x China’s total over the same time period.15 “People tend to overestimate the impact of new trends in the short term but underestimate them in the long term” – Dev Ittycheria, CEO of MongoDB Inc., on the topic of AI.16 Emerging trends like AI often create immediate attention with their flashy impact, but their profound transformative potential tends to unfold gradually, ultimately reshaping industries and societies. A basket of cloud computing companies represented by the Indxx Global Cloud Computing v2 Index shows a current 12-month forward consensus sales growth of 10.25% with a Price to Sales Growth ratio of 0.40x. This compares against a 12-month average of 8.72% and 0.47x respectively. Similarly, a basket of IOT companies represented by the Indxx Global Internet of Things Thematic v2 Index currently projects 12-months forward sales growth of 4% with a price-to-Sales Growth ratio of 0.66x. which is in line with its 12-month historical average.17
Cloud companies propel AI’s integration across industries. Challenges persist, but the U.S. leads with innovation, backed by strong earnings. As AI’s long-term potential unfolds, cloud investments could continue in reshaping industries, with IOT connecting the physical to the digital world.
Navigating Shopping Trends in the Digital Age – Evolving spending patterns driven by digital-savvy generations, social commerce, and cross-border trends are propelling the e-commerce landscape.
Connectivity continues to shape Gen Z and younger consumers’ spending habits across borders. In 2023, of the 20.8% of retail spending, $6.3 trillion will be online, a 10.4% YoY rise. The U.S. saw 7.6% YoY e-commerce growth in 2022, surpassing $1 trillion.18 China and India also confirm this trend, with growing purchasing power reshaping preferences. China leads e-commerce globally with $2.9 trillion sales in 2022, representing 9% growth on the prior year and is set to approach $4 trillion by 2026.19 Forbes predicts the e-commerce market to surpass $8.1 trillion by 2026, representing a 9% CAGR.20, 21
Traditional shopping norms are being rewritten as consumers embrace innovative shopping methods such as streaming and instant retail. Further urbanization and continued adoption of smartphones and the internet contribute to growth as millennials use these devices to do their shopping. Social commerce blends visual platforms like Instagram with seamless in-app purchases, simplifying buying through appealing interfaces.22 In China, 50% of online shoppers are buying via social networks.23 In the U.S., 96.9 million shop on social media, with 55% of 18-24-year-olds having purchased online.24 Cross-border e-commerce aids SMEs in expanding globally, with around 70% of American SMEs using web stores or online marketplaces, often across multiple platforms.25
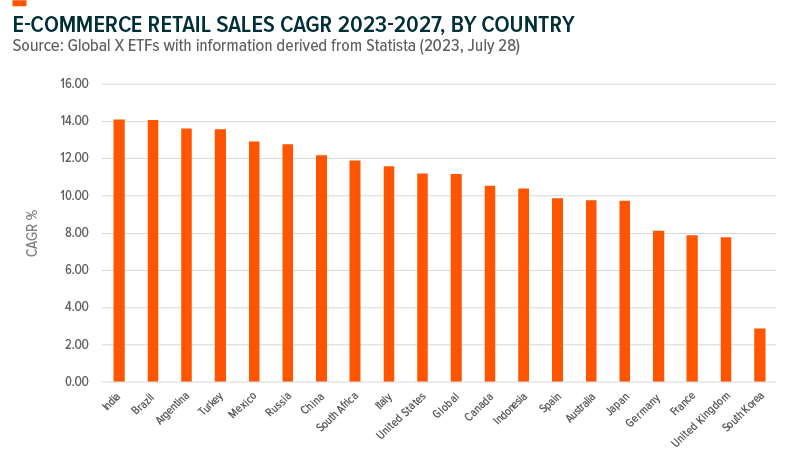
Amazon’s Q2 exhibited positive trailing 12-month free cash flow at $7.9B, alongside a notable 74% growth in operating cash flow, reaching $61.8B, the highest in 8 quarters. Its rapid Prime delivery quadrupled since 2019, with 1.8 billion one-day deliveries. The autonomous last-mile delivery sector is projected to grow at a 20% CAGR up to 2030, fueled by tech advancements and e-commerce demand.26 Shopify excelled with a remarkable 30% YoY surge in Q2 monthly recurring revenue (MRR), maintaining a strong 32% CAGR in MRR over 5 years, reaching $139 million from $116million in the prior year.27 Alibaba’s witnesses strong Q2 earnings, with revenue up by 14% and non-GAAP earnings growing over 48% YoY. The company is dedicated to enhancing AI initiatives for local needs in China and Asia. Despite market uncertainties, Alibaba’s consumer-focused sectors thrived, driven by digital adoption, with notable YoY growth in local services, logistics, delivery, and digital media divisions.28 Latin America countries such as Argentina and Brazil are amongst the fastest growing ecommerce markets both with a CAGR of over 13.6% until 2027.29 The region experienced rapid digital ad growth in 2022, led by Mercadolibre with an impressive 72.1% increase. MELI’s growth trajectory is expected to continue, with over 70% ad revenue growth in 2023.
A basket of online business and e-commerce companies represented by the Solactive E-commerce v2 Index is currently trading at a Price to Sales Growth ratio of 0.08x, versus its 12-month historical average of 0.09x and an EV/SG of 0.20x. The consensus forecasted 12-month forward sales growth rate is currently at 12%.30 The evolving spending behaviors of tech-savvy generations, coupled with the rise of social commerce and cross-border shopping trends continue to spotlight long-term tailwinds behind the online business and e-commerce theme.
This post first appeared September 4th on the GlobalX ETF blog.
PHOTO CREDIT: https://www.shutterstock.com/g/whyframe
Via SHUTTERSTOCK
Footnotes
- U.S. Bureau of Economic Analysis, Gross Domestic Product, Second Quarter 2023 (Second Estimate) and Corporate Profits (Preliminary), 30 August 2023.
- U.S. Bureau of Economic Analysis, Personal Income and Outlays, July 2023, Accessed on 31 August, 2023.
- Bloomberg Data on the CDX Investment Grade Index as of 1st September, 2023 and retrieved on 1st September.
- Congress.Gov. (2021, November 15). Legislation: 117th congress: H.R.3684 – Infrastructure Investment and Jobs Act.
- The Wall Street Journal. (2023, April 8). America is Back in the Factory Business.
- The White House (2023, July 27). The Advance Estimate of Second Quarter Real GDP. Accessed on 24 August 2023.
- Bossche, Ehrig, Troncoso, & Luo, 2022; 2. WSJ, 2023; Visual (LHS): Bloomberg, L.P., n.d.; Visual (RHS): U.S. Census Bureau, 2023.
- The White House (14 August, 2023),Biden Harris Administration Releases Final Guidance to Bolster American Made Good in Federal Infrastructure Projects.
- Wilowski, M., Investopedia: Earnings Season Was Good For Corporate Profits Even If Revenues Weren’t Great, 8 August 2023.
- Bloomberg Data as of 25 August 2023 and retrieved on 25 August 2023 from Global X Bloomberg Terminal.
- Zaidi, E. And Menon, S., Gartner: Magic Quadrant for Data Integration Tools, 17 August 2022.
- Precedence Research, Generative AI Market Growth is Booming with 27.02%, August 2023.
- Bass, D., Bloomberg News: Amazon Enters Health Care Generative AI Market, Adds Chatbot Tools, 26 July 2023.
- Precedence Research, Generative AI Market Growth is Booming with 27.02%, August 2023.
- Stanford University, The AI Index Report 2023: Measuring trends in Artificial Intelligence.
- The Stack, Mongo DB CEO: “It wasn’t AI…”.
- Bloomberg Data as of 25 August 2023 and retrieved on 25 August 2023 from Global X Bloomberg Terminal.
- Goldberg, J., Forbes, E-Commerce Sales Grew 50% to $870 Billion During The Pandemic, 18 February 2022.
- Statista, Retail e-commerce sales in China for 2021 and 2021 with forecasts until 2026, July 2022.
- Forbes, E-Commerce Sales Grew 50% to $870 Billion During The Pandemic, February, 18 2022.
- Statista, Retail e-commerce sales worldwide from 2014 to 2026, 21 September 2022.
- Maier, J. and Cluver, M., Global X ETFs, Thematic Investing White Paper August 2023.
- Baluch, A. and Main, K., Forbes Advisor, 38 E-Commerce Statistics of 2023, 8 February 2023.
- Ibid.
- Grand View Research, Cross-border B2C E-commerce Market Worth $5,576.73 billion by 2030.
- Amazon Investor Relations, Amazon.com announces second quarter results, 3 August 2023.
- Shopify Investors Relations, Shopify announces second-quarter 2023 financial results 2 August 2023.
- Hall, C. and Malik, Y., Reuters: Alibaba’s quarterly revenue beats despite China’s sputtering economy, 10 August 2023.
- Statista, Retail e-commerce sales compound annual growth rate (CAGR) from 2023 to 2027, by country, 28 July 2023.
- Bloomberg Data as of 25 August 2023 and retrieved on 25 August 2023 from Global X Bloomberg Terminal.
Disclosure
Investing involves risk, including the possible loss of principal. Diversification does not ensure a profit nor guarantee against a loss.
This material represents an assessment of the market environment at a specific point in time and is not intended to be a forecast of future events, or a guarantee of future results. This information is not intended to be individual or personalized investment or tax advice and should not be used for trading purposes. Please consult a financial advisor or tax professional for more information regarding your investment and/or tax situation.