By Lily Chung, FTSE Fixed Income and Multi-Asset Index Product Manager and Ian Chen, FTSE Fixed Income and Multi-Asset Index Product Associate
- APAC impact bond market continues growth trajectory and accounts for 25% of the global accumulated issuance. China, Japan, and South Korea are leading the way.
- Investors’ interest in impact bonds has been rising in the APAC region, with the investment focus extending from green bonds to social, sustainability and sustainability-linked bonds themes.
- Despite headwinds, APAC impact bond market performance had shown better resilience compared to its global peers during the fixed income down trend last year.
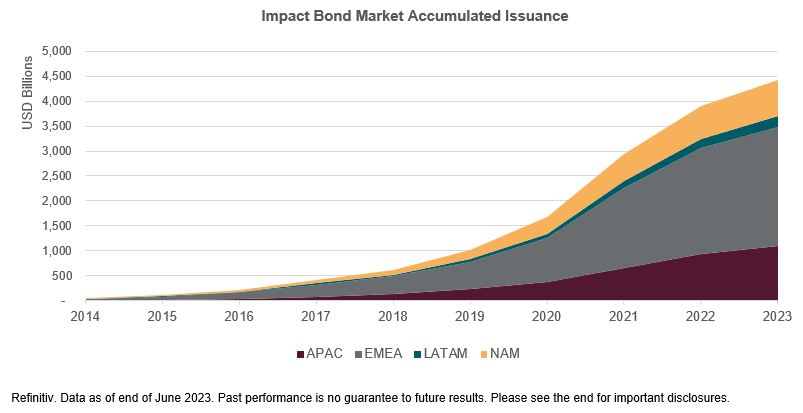
As of the end of June 2023, the global impact bond market has reached an impressive 4.4 trillion USD, comprising green, social, sustainability, and sustainability-linked bonds (GSSS). European countries have played a significant role in driving this growth. While the APAC impact bond market started later than Europe and North America, it has steadily grown and surpassed North America, securing the second- place in 2017. As of June 2023, the APAC market has exceeded the 1 trillion USD milestone, reaching 1.09 trillion USD and accounting for 25% of the global accumulated issuance.
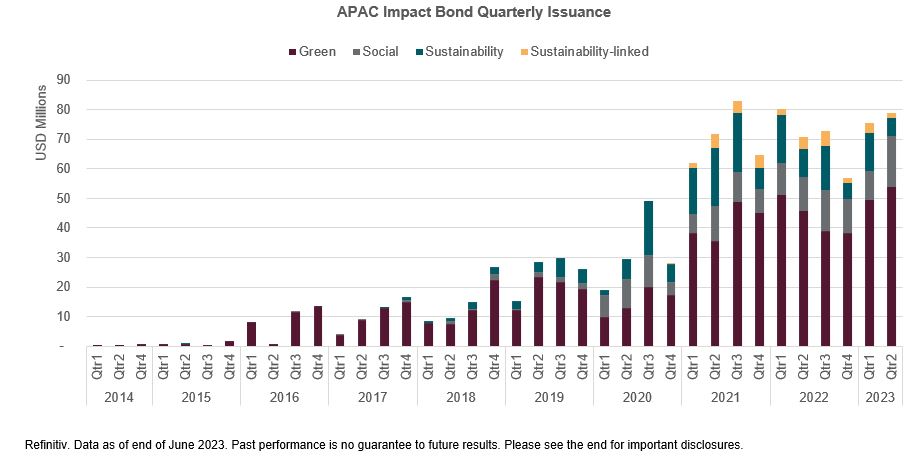
The APAC market has seen the debut of social and sustainability bonds in late 2017. While green bonds still dominate around 66% of the market, we can observe the remarkable growth of social and sustainability bonds, which have increased from zero to 14% and 17% accumulative volumes respectively over the years. Sustainability-linked bonds had its first issuance in APAC in late 2020 and held around 3% of market share. In 2022, we observed a decline in bond issuances during the second half of the year due to the rising interest rate and the surge of market volatility. However, the market has recovered strongly in the first and second quarters of 2023 and was nearly back to the level in Q1 2022.
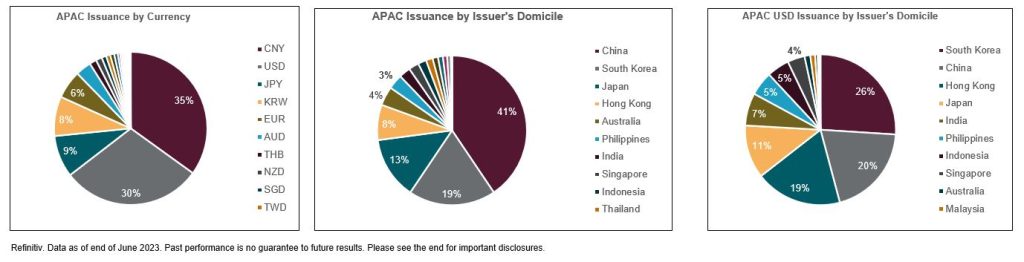
In the APAC impact bond market, the Chinese yuan (Renminbi) and the US dollar stand out as the two major currencies, holding shares of 35% and 30% respectively. The Japanese Yen, South Korean Won, and the Euro follow, with shares of 9%, 8% and 6% respectively. From the issuer’s domicile perspective, China leads the bond issuance with a significant share of 41%. South Korea takes the second position with a share of 19%, followed by Japan at 13% and Hong Kong at 7.6%. The top 4 countries (by issuer’s domiciles) make up more than 80% of the market share. On the other hand, when focusing on the issuance of US dollar-denominated APAC impact bonds, South Korea has surpassed China to become the largest issuing country, accounting for 26%. China and Hong Kong closely trail behind, with shares of 20% and 19% respectively. Japan accounts for 11% of the total issuance.
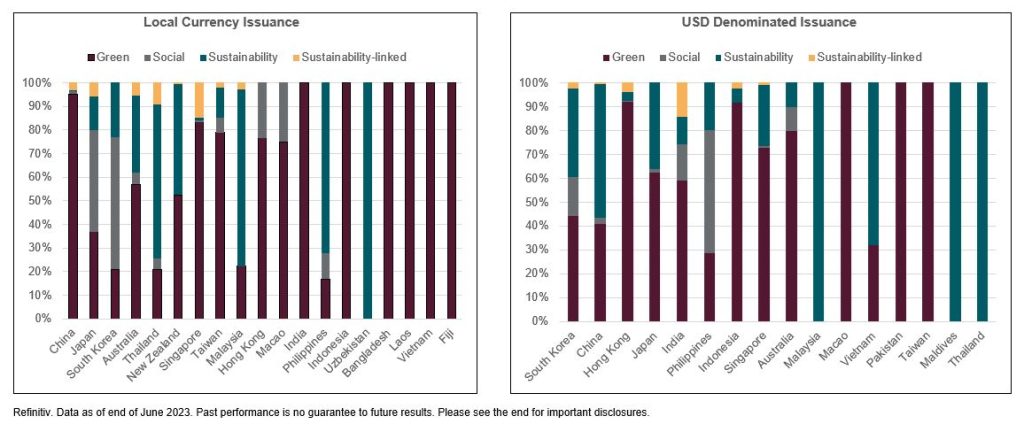
When examining the proportions of different types of impact bonds issued by various countries, we can see that in China, green bonds account for a staggering 95% of the local currency-denominated issuance. Japan and South Korea ranked second and third respectively by total local currency issuances, with social bonds being the dominant type. Australia and Thailand ranked fourth and fifth, with relatively high portions of sustainable bonds at 32% and 65% respectively.
In terms of US dollars-denominated issuance, among the top five issuing countries, most of them still predominantly issue green bonds, particularly in the case of Hong Kong, where it accounts for 92%. However, China stands out as the only country with sustainability bonds surpassing 50%, making up 56% of its issuance. Additionally, it’s worth noting that India has a relatively higher proportion of sustainability-linked bonds at 14%.
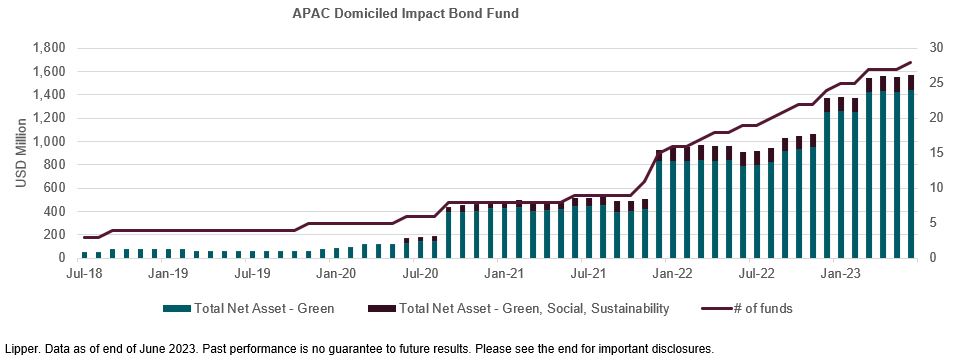
The number of impact bond-themed funds domiciled in APAC region has been increasing notably in the past 3 years, from 8 at the end of 2020 to 28 as of H2 2023, with total net asset of the funds reaching 1.4 billion USD. 85% of the funds in terms of total net assets are only green bond-focused, as China domiciled funds which account for more than a half of market share are all invested in green bonds and Carbon Neutrality bonds[1]. The other 15% of funds invest in not only green bonds but also social and sustainability bonds – we’ve seen the interest from Australia, Hong Kong, and New Zealand, to serve investors’ needs for diversified impact investing solutions. Australia is the second largest impact bond fund market in the Asia-Pacific region.
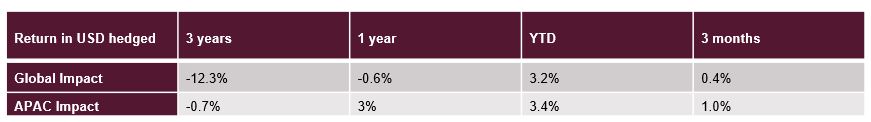
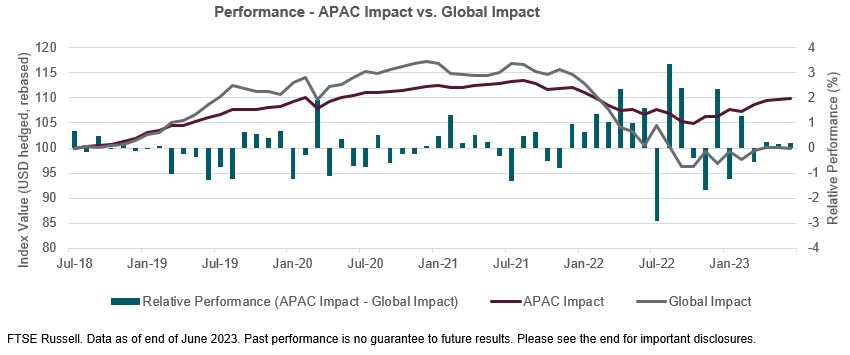
With a steady growth in issuance, APAC Impact[2] has made up 17% of the FTSE Global Impact Bond 0+ Years Index (“Global Impact”) by the end of Q2 2023. In terms of performance, the index value of APAC Impact has increased by 3.4% YTD, slightly outperforming Global Impact, which climbed 3.2% over the same period. APAC Impact has exhibited lower volatility compared to Global Impact over the past five years. Despite facing headwinds such as rising inflation, monetary tightening, and geopolitical turmoil, APAC Impact declined 5.2% last year, while Global Impact dropped 15.6%.
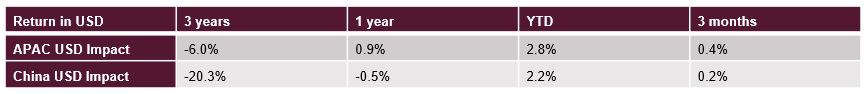
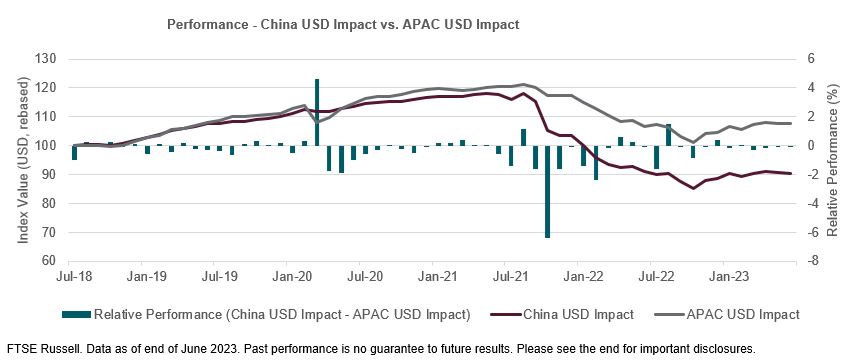
Taking a closer look at US dollar denominated impact bonds issued by Chinese issuers, China USD Impact[3] has hugely underperformed APAC USD Impact[4] in 2021 and 2022 due to several Chinese property dollar bonds defaults. Nevertheless, we’ve seen the market stabilize and it gained 2.2% YTD.
In summary, by June 2023, cumulative impact bonds issuance had topped 4.4 trillion USD captured by Refinitiv database, with APAC issuance growing steadily and accounting for 25% of total issuance over the years. The APAC impact bond market is quite concentrated with 84.66% of the market being issued by China, South Korea, Japan, Hong Kong, and Australia. While green bonds are the dominant theme in most of the countries, especially taking over 90% shares in Chinese onshore and Hong Kong US dollar market, interestingly, social bonds are the largest sector in South Korea and Japan local market, and sustainability bonds contribute a third in APAC US dollar impact bond market. We expect the demand for impact bond funds to keep the momentum, with the investment focus extending from green bonds to social, sustainability and sustainability-linked bonds themes. Despite challenges in the Chinese property sector in 2021-2022, APAC impact bond market performance had shown better resilience compared to its global peers during the fixed income down trend last year. As most central banks are toward the end of interest rate hikes, we expect market conditions to stabilize and issuance level of APAC region to slowly improve in coming months.
This post first appeared on August 14th 2023, FTSE Russell Blog
PHOTO CREDIT https://www.shutterstock.com/g/Pcess609
Via SHUTTERSTOCK
Footnotes
[1] Carbon Neutrality Bonds: Sub-type of green bonds in China whose use of proceeds are dedicated to projects that have carbon reduction benefits.
[2] APAC Impact: The APAC Impact is a customized benchmark of multi-currency impact bonds whose issuers domiciled in APAC.
[3] China USD Impact: The China USD Impact is a customized benchmark of US Dollar denominated impact bonds whose issuers domiciled in China.
[4] APAC USD Impact: The APAC USD Impact is a customized benchmark of US Dollar denominated impact bonds whose issuers domiciled in the Asia-Pacific region.
DISCLOSURE
All information is provided for information purposes only. All information and data contained in this publication is obtained by the LSE Group, from sources believed by it to be accurate and reliable. Because of the possibility of human and mechanical error as well as other factors, however, such information and data is provided “as is” without warranty of any kind. No member of the LSE Group nor their respective directors, officers, employees, partners or licensors make any claim, prediction, warranty or representation whatsoever, expressly or impliedly, either as to the accuracy, timeliness, completeness, merchantability of any information or of results to be obtained from the use of FTSE Russell products, including but not limited to indexes, data and analytics, or the fitness or suitability of the FTSE Russell products for any particular purpose to which they might be put. Any representation of historical data accessible through FTSE Russell products is provided for information purposes only and is not a reliable indicator of future performance.
No responsibility or liability can be accepted by any member of the LSE Group nor their respective directors, officers, employees, partners or licensors for (a) any loss or damage in whole or in part caused by, resulting from, or relating to any error (negligent or otherwise) or other circumstance involved in procuring, collecting, compiling, interpreting, analyzing, editing, transcribing, transmitting, communicating or delivering any such information or data or from use of this document or links to this document or (b) any direct, indirect, special, consequential or incidental damages whatsoever, even if any member of the LSE Group is advised in advance of the possibility of such damages, resulting from the use of, or inability to use, such information.
Past performance is no guarantee of future results. Charts and graphs are provided for illustrative purposes only. Index returns shown may not represent the results of the actual trading of investable assets. Certain returns shown may reflect back-tested performance. All performance presented prior to the index inception date is back-tested performance.
Back-tested performance is not actual performance, but is hypothetical. The back-test calculations are based on the same methodology that was in effect when the index was officially launched. However, back- tested data may reflect the application of the index methodology with the benefit of hindsight, and the historic calculations of an index may change from month to month based on revisions to the underlying economic data used in the calculation of the index.
This publication may contain forward-looking assessments. These are based upon a number of assumptions concerning future conditions that ultimately may prove to be inaccurate. Such forward-looking assessments are subject to risks and uncertainties and may be affected by various factors that may cause actual results to differ materially.