

Jeremy Schwartz, CFA, Global Chief Investment Officer
Recently, tech stocks have been soaring, stirring up a mix of excitement and anxiety. As questions swirl about whether the outperformance can be sustained, much like how growth beat value for much of the last 15 years, there’s also a fear that this artificial intelligence (AI) boom may begin to rhyme with the internet explosion and subsequent bust of the 2000–2002 period.
Today, gains in the sector are concentrated in large companies like Nvidia and Meta, with year-to-date (YTD) returns standing at 200.71% and 144.52%, respectively. As a result, the Nasdaq 100 has outperformed the S&P 500 by around 23% YTD,1 mostly due to its extra weighting in the Information Technology sector (~60% vs. ~27%).2
This rally has been accompanied by a significant expansion in valuation multiples, specifically the price-to-sales (P/S) ratio. Particularly relevant for the Tech sector, the P/S ratio offers a way to evaluate companies that may not yet be profitable but that are generating sales—a common scenario among new and innovative firms. For many in the Tech sector today, this ratio has soared to unprecedented levels.
Figure 1: A Long Time Series Shows Three Distinct Peaks in Tech Stocks’ Price-to-Sales Ratios
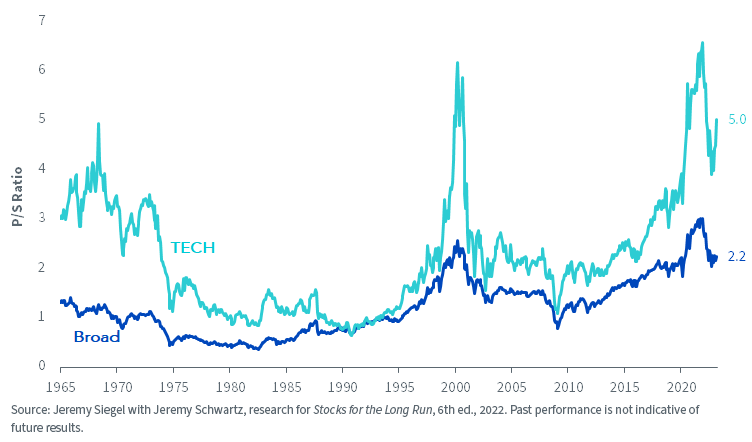
At the end of March 2023, Nvidia became the company with the highest P/S ratio in both the S&P 500 and Nasdaq 100 indexes. It has only increased since then, reaching a P/S ratio of over 40, based on the trailing-12 months of sales. Nvidia’s quarterly earnings report, however, did forecast a large (60%) jump in future sales, so analysts are now pricing in future sales, which brings down the multiple to 25 times expected sales over the next 12 months.3
This leads us to our key question: based on an historical sample of companies that reached these valuations in the past, what are the chances Nvidia can continue to outperform?
P/S Ratios: From Rarity to Normality
From the late 1960s to the early 1990s, high P/S ratios were rare. It was uncommon to find a company with a P/S ratio over 25. On the rare occasions it did happen, it was usually just one or two firms each year, and the percentage of the total market cap they represented was negligible.
Fast forward to today, and high P/S ratios have become almost routine, especially in the Tech sector, and it begs the question as to whether this is the new normal.
Figure 2: Number of Companies and Percent of Market Cap by Companies in the Top 500 Caps with P/S > 25 Each Year
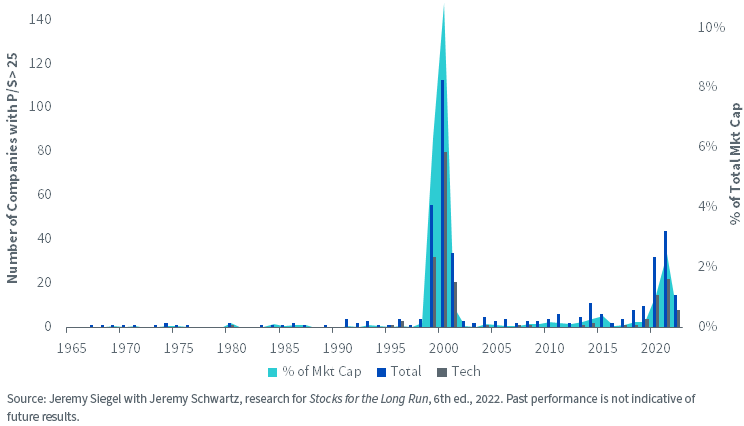
The chart above shows the number of companies among the largest 500 companies that reached a P/S ratio of 25 or above at least once within each calendar year, alongside the percentage of total market cap these companies represent.
The tech bubble of 1999–2002 saw a drastic surge in companies with high P/S ratios. In 1999 alone, there were 56 companies with a P/S ratio over 25, representing over 6% of the total market cap.
The trend peaked in 2000, with 113 companies and over 10% of total market cap. For most of the 2000s, several companies each year reported a P/S ratio over 25, making up a small but not insignificant portion of the total market cap.
The COVID-19 era of 2019–2023 saw another surge in high P/S ratios, with numbers echoing the tech bubble. In 2020, there were 32 companies with P/S ratios over 25, making up 1.10% of the total market cap.
The trend extended into 2021, when 44 companies contributed to 2.46% of the total market cap. This shift was partly propelled by an influx of high-profile initial public offerings (IPOs), as newly public companies often command high valuations. The momentum shows no signs of waning in 2023, with over a dozen companies already boasting a 25 P/S in Q1 alone, the majority of which are Tech stocks.
Dynamics of Top P/S Stocks
Among the universe of the top 500 largest U.S. companies by market cap, 99 different companies reached the distinction of having the highest P/S ratio of all companies since the 1960s. Nvidia now holds this title today.
The Tech sector takes the lion’s share of the highest multiple stocks, representing 27.3% of the companies, followed by the Health Care and Energy sectors, accounting for 22.2% and 17.2%, respectively.
To understand the dynamics of the companies with the top P/S ratio, we examined their performance over various periods following the point at which they claimed the top spot. We scrutinized their returns over the subsequent 1-, 3- and 5-year periods, and until the end of sample or March 2023.
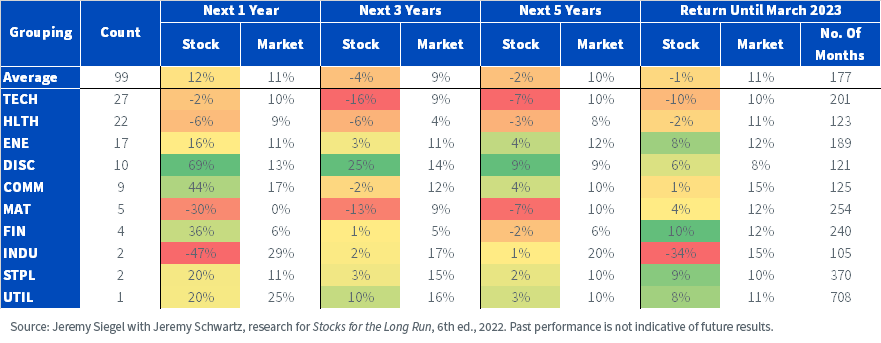
Figure 3: Subsequent Performance after Companies Reach Top P/S for the First Time
An interesting pattern emerged.
In the year following the point when a stock took the top spot for the P/S ratio for the first time, these companies continued outperforming—on average beating the S&P 500 by almost 1.5%.
But their momentum faltered in the years that followed; within the next three years, their average annual return declined to -4.4%, and the five-year average annual return fell further to -1.5%. Notably, the markets were annualizing over 9% over those next 3–5 years, so their underperformance relative to the market was by more than double digits. When we take the entire history of these stocks, their average return still falls short of the market by over 12% a year.
Even when we break it down by sector, it seems like once a company reached the position of top P/S, it struggled to maintain its momentum and keep up with the market. The Tech and Health Care sectors, those with the most companies appearing in this top spot, don’t even outperform in the short term, but have negative returns on average. Sectors like Energy, Consumer Discretionary and Communication Services do tend to outperform the market in the short term—but investors must be nimble and not stick with the stocks for too long.
Declining Odds of Outperformance
Let’s take a step back now and focus less on the highest P/S stocks, but instead on all 2,691 companies that have been in the largest 500 at some point. The tables below show how frequently companies reach a specific P/S threshold, and the odds they will outperform the market in the next 1, 3, 5, 10 and 20 years.
Figure 4a: Probability that Stocks Outperform the Market at Higher Valuations
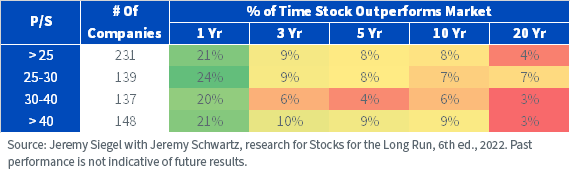
Figure 4b: Median Relative Performance of Stocks at Higher Valuations
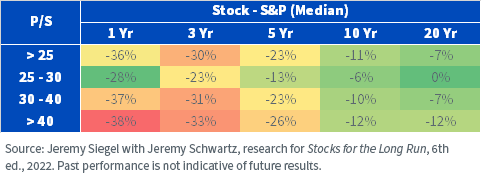
For the 231 companies that have reached a P/S over 25, only 21% of the time did they outperform the market in the next year, with a median relative return of -36%.
Looking at longer horizons, this percentage becomes even worse, reaching 9% over the next three years, and a mere 4% over the next 20 years. For higher P/S ratios (>40) companies are even less likely to outperform the market on all time frames. The odds become stacked against you having a winning long-term stock at these valuations.
The market has seen a shift in recent years, with high P/S ratios becoming increasingly common, particularly in the Tech sector. Our analysis suggests that an overemphasis on high P/S stocks may falter in the long run, as it may prove difficult for these companies to sustain the rapid growth required to justify these valuations and continue their performance trajectory.
Footnotes:
1Source: Performance data from Yahoo Finance, YTD refers to 1/1/23–7/21/23.
2Sources: S&P 500 Index and Nasdaq 100 Index factsheets, with data as of 6/30/23.
3Source: https://investor.nvidia.com/news/press-release-details/2023/NVIDIA-Announces-Financial-Results-for-First-Quarter-Fiscal-2024/default.aspx
This post first appeared on July 28th 2023, WisdomTree Blog
PHOTO CREDIT: https://www.shutterstock.com/g/sdecoret
Via SHUTTERSTOCK
Disclosure:
U.S. investors only: Click here to obtain a WisdomTree ETF prospectus which contains investment objectives, risks, charges, expenses, and other information; read and consider carefully before investing.
There are risks involved with investing, including possible loss of principal. Foreign investing involves currency, political and economic risk. Funds focusing on a single country, sector and/or funds that emphasize investments in smaller companies may experience greater price volatility. Investments in emerging markets, currency, fixed income and alternative investments include additional risks. Please see prospectus for discussion of risks.
Past performance is not indicative of future results. This material contains the opinions of the author, which are subject to change, and should not to be considered or interpreted as a recommendation to participate in any particular trading strategy, or deemed to be an offer or sale of any investment product and it should not be relied on as such. There is no guarantee that any strategies discussed will work under all market conditions. This material represents an assessment of the market environment at a specific time and is not intended to be a forecast of future events or a guarantee of future results. This material should not be relied upon as research or investment advice regarding any security in particular. The user of this information assumes the entire risk of any use made of the information provided herein. Neither WisdomTree nor its affiliates, nor Foreside Fund Services, LLC, or its affiliates provide tax or legal advice. Investors seeking tax or legal advice should consult their tax or legal advisor. Unless expressly stated otherwise the opinions, interpretations or findings expressed herein do not necessarily represent the views of WisdomTree or any of its affiliates.
The MSCI information may only be used for your internal use, may not be reproduced or re-disseminated in any form and may not be used as a basis for or component of any financial instruments or products or indexes. None of the MSCI information is intended to constitute investment advice or a recommendation to make (or refrain from making) any kind of investment decision and may not be relied on as such. Historical data and analysis should not be taken as an indication or guarantee of any future performance analysis, forecast or prediction. The MSCI information is provided on an “as is” basis and the user of this information assumes the entire risk of any use made of this information. MSCI, each of its affiliates and each entity involved in compiling, computing or creating any MSCI information (collectively, the “MSCI Parties”) expressly disclaims all warranties. With respect to this information, in no event shall any MSCI Party have any liability for any direct, indirect, special, incidental, punitive, consequential (including loss profits) or any other damages (www.msci.com)
Jonathan Steinberg, Jeremy Schwartz, Rick Harper, Christopher Gannatti, Bradley Krom, Kevin Flanagan, Brendan Loftus, Joseph Tenaglia, Jeff Weniger, Matt Wagner, Alejandro Saltiel, Ryan Krystopowicz, Brian Manby, and Scott Welch are registered representatives of Foreside Fund Services, LLC.
WisdomTree Funds are distributed by Foreside Fund Services, LLC, in the U.S. only.
You cannot invest directly in an index.


