How companies can build greater investor confidence by disclosing historical target data and publishing transition plans about their future climate-related commitments.
By Félix Fouret, SI Research Lead
Corporate climate commitments used to be neatly tucked away in responsibility reports, but now companies boldly publicize their promises of ‘halving emissions by 2030’ and ‘achieving net zero by 2050’. Between the 2015 Paris COP and Glasgow COP in 2021, listed issuers setting carbon targets went from 900 to over 2000.[1] And while just 4% of FTSE 100 companies set net zero targets in 2018, over 85% did by the end of 2022.[2] Crucially, investors are also using corporate targets to test companies’ alignment with 1.5°C or 2°C pathways (e.g. through initiatives such as TPI and SBTi) and to assess the net zero alignment of their own portfolios – think financed emissions[3] or Implied Temperature Rise (ITR) metrics.[4]
But are companies actually delivering on these targets? Currently no systematic framework exists to assess companies’ progress towards these voluntary targets, and, because most companies have only set targets in the last few years, in many cases, it’s too soon to tell.
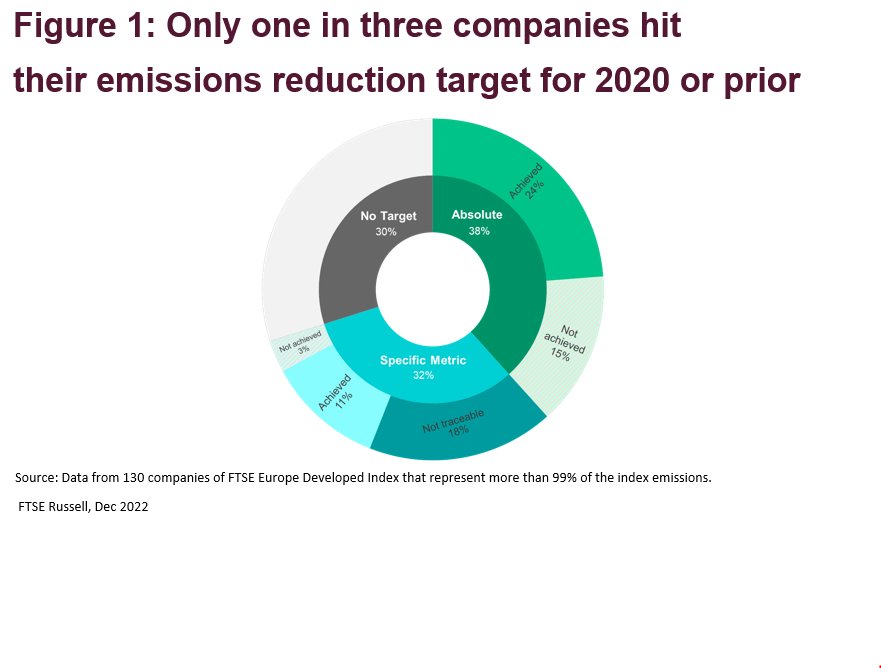
However, we do have some data to check whether companies have achieved their historical goals. We studied the FTSE Europe Developed Index as it has the highest rate of companies disclosing a carbon target for 2020 or prior.[5] We then focused on a subsample of the 130 companies that represent more than 99% of the index emissions[6] – over two-thirds of which had a set an emissions reductions target for 2020 or prior to that (compare this to the FTSE All World, which covers large and mid-cap companies globally in which only 15% of companies had set a 2020 or pre-2020 target).
Here’s what we found (see Figure 1):
1) Bespoke target metrics and poor follow-on disclosures makes robust tracking often impossible. Almost a third of the companies set their targets using hard-to-compare, bespoke metrics (net emissions, production-based intensity metrics, decarbonisation index, against a projected BAU, etc). But worse, after setting the target, they often failed to report on these metrics in subsequent disclosures. After carefully reviewing our sample, we were only able to identify the level of emissions reductions achieved in the target year for less than half of these companies.
2) Where we can track targets, almost half of companies did not hit them. Among the companies that had set a target for 2020 or earlier and reported on their target year emissions, only slightly more than half achieved at least one of their targets.
Four key actions to enhance trust in corporate carbon commitments
A poor corporate track record in meeting emissions reductions targets presents an urgent challenge and undermines trust in corporate carbon commitments from investors and other stakeholders. Four key actions can help to improve the situation and should be central to investor engagement on climate:
- Emphasize the importance of setting clearer emissions reductions targets (we have written extensively about this here and here, including proposing a simple tabular disclosure template that has been featured as best practice example in the updated TCFD Guidance).
- There also needs to be a greater focus on short-term emissions reductions with a two to five year focus, as we need to be able to follow companies’ emissions pathways on a more immediate and regular basis. This chimes with the key findings of CA100+, which finds that only 7% of systemically important carbon emitters currently meet all criteria for short-term targets, a much lower share than for medium and long-term targets.[7]
- Push for better ongoing disclosures enable the consistent tracking of corporate emissions against reductions targets over time. This should also include historical data points, which currently are often difficult to interpret or missing entirely. New standards and regulations on climate disclosures by the SEC, the ISSB, EFRAG and others will help, but it will take time for these to take effect. he new V.2.0 CA100+ framework (which LSEG helped to develop) includes an indicator to track companies’ historical GHG emissions performances.[8]
- Last but not least, clearly laid out Transition Plans are critical to enhance the credibility of emissions reductions commitments(at LSEG we were proud to published our first one last year).[9] These plans are key for investors to understand if companies have set out coherent 2050 pathway or if their proposed emissions reductions are based on vague plans and unproven assumptions. Robust guidance for standardized transition plan disclosures – such as the ones we are helping to develop in the UK Governments’ Transition Plan Taskforce (TPT) and the Glasgow Financial Alliance for Net Zero (GFANZ) – are key to guide companies in providing meaningful transition plan disclosures.
This post first appeared on July 20th 2023, FTSE Russell Blog
PHOTO CREDIT: https://www.shutterstock.com/g/Sepp+photography
Via SHUTTERSTOCK
[1] J. Kooroshy, F. Fouret, C. Dodsworth, and J. Simmons. Towards investor-oriented carbon targets data. FTSE Russell Index Insight, 2021.
[2] Article 3 in DP23/1, Financial Conduct Authority (FCA)
[3] The Global GHG Accounting and Reporting Standard for the Financial Industry (carbonaccountingfinancials.com)
[4] PAT_Measuring_Portfolio_Alignment_Technical_Considerations.pdf (tcfdhub.org)
[5] 52% of the index companies have published a target with a targeted year prior to 2020.
[6] Scope 1 & 2 total emissions of the index are the weighted average of the index constituents’ emissions.
[7] Climate Action 100+ Net Zero Company Benchmark shows an increase in company net zero commitments, but much more urgent action is needed to align with a 1.5°C future | Climate Action 100+
[8] Climate-Action-100-Net-Zero-Company-Benchmark-2.0-Consultation-Guide-1013.pdf (climateaction100.org)
[9] Since November 2021 and the emergence of this terminology, multiple organizations (GFANZ, CA100+, TPT, EFRAG) have already defined how companies should disclose information when talking about transition or net-zero.
© 2023 London Stock Exchange Group plc and its applicable group undertakings (the “LSE Group”). The LSE Group includes (1) FTSE International Limited (“FTSE”), (2) Frank Russell Company (“Russell”), (3) FTSE Global Debt Capital Markets Inc. and FTSE Global Debt Capital Markets Limited (together, “FTSE Canada”), (4) FTSE Fixed Income Europe Limited (“FTSE FI Europe”), (5) FTSE Fixed Income LLC (“FTSE FI”), (6) The Yield Book Inc (“YB”) and (7) Beyond Ratings S.A.S. (“BR”). All rights reserved.
FTSE Russell® is a trading name of FTSE, Russell, FTSE Canada, FTSE FI, FTSE FI Europe, YB and BR. “FTSE®”, “Russell®”, “FTSE Russell®”, “FTSE4Good®”, “ICB®”, “The Yield Book®”, “Beyond Ratings®” and all other trademarks and service marks used herein (whether registered or unregistered) are trademarks and/or service marks owned or licensed by the applicable member of the LSE Group or their respective licensors and are owned, or used under license, by FTSE, Russell, FTSE Canada, FTSE FI, FTSE FI Europe, YB or BR. FTSE International Limited is authorized and regulated by the Financial Conduct Authority as a benchmark administrator.
All information is provided for information purposes only. All information and data contained in this publication is obtained by the LSE Group, from sources believed by it to be accurate and reliable. Because of the possibility of human and mechanical error as well as other factors, however, such information and data is provided “as is” without warranty of any kind. No member of the LSE Group nor their respective directors, officers, employees, partners or licensors make any claim, prediction, warranty or representation whatsoever, expressly or impliedly, either as to the accuracy, timeliness, completeness, merchantability of any information or of results to be obtained from the use of FTSE Russell products, including but not limited to indexes, data and analytics, or the fitness or suitability of the FTSE Russell products for any particular purpose to which they might be put. Any representation of historical data accessible through FTSE Russell products is provided for information purposes only and is not a reliable indicator of future performance.
No responsibility or liability can be accepted by any member of the LSE Group nor their respective directors, officers, employees, partners or licensors for (a) any loss or damage in whole or in part caused by, resulting from, or relating to any error (negligent or otherwise) or other circumstance involved in procuring, collecting, compiling, interpreting, analyzing, editing, transcribing, transmitting, communicating or delivering any such information or data or from use of this document or links to this document or (b) any direct, indirect, special, consequential or incidental damages whatsoever, even if any member of the LSE Group is advised in advance of the possibility of such damages, resulting from the use of, or inability to use, such information.
No member of the LSE Group nor their respective directors, officers, employees, partners or licensors provide investment advice and nothing in this document should be taken as constituting financial or investment advice. No member of the LSE Group nor their respective directors, officers, employees, partners or licensors make any representation regarding the advisability of investing in any asset or whether such investment creates any legal or compliance risks for the investor. A decision to invest in any such asset should not be made in reliance on any information herein. Indexes cannot be invested in directly. Inclusion of an asset in an index is not a recommendation to buy, sell or hold that asset nor confirmation that any particular investor may lawfully buy, sell or hold the asset or an index containing the asset. The general information contained in this publication should not be acted upon without obtaining specific legal, tax, and investment advice from a licensed professional.
Past performance is no guarantee of future results. Charts and graphs are provided for illustrative purposes only. Index returns shown may not represent the results of the actual trading of investable assets. Certain returns shown may reflect back-tested performance. All performance presented prior to the index inception date is back-tested performance. Back-tested performance is not actual performance, but is hypothetical. The back-test calculations are based on the same methodology that was in effect when the index was officially launched. However, back-tested data may reflect the application of the index methodology with the benefit of hindsight, and the historic calculations of an index may change from month to month based on revisions to the underlying economic data used in the calculation of the index.
This document may contain forward-looking assessments. These are based upon a number of assumptions concerning future conditions that ultimately may prove to be inaccurate. Such forward-looking assessments are subject to risks and uncertainties and may be affected by various factors that may cause actual results to differ materially. No member of the LSE Group nor their licensors assume any duty to and do not undertake to update forward-looking assessments.
No part of this information may be reproduced, stored in a retrieval system or transmitted in any form or by any means, electronic, mechanical, photocopying, recording or otherwise, without prior written permission of the applicable member of the LSE Group. Use and distribution of the LSE Group data requires a license from FTSE, Russell, FTSE Canada, FTSE FI, FTSE FI Europe, YB, BR and/or their respective licensors.