

By: Ken Frier, CIO Atlas Capital Advisors
Main Points
- Nvidia valuations today closely resemble Cisco at its peak in March 2000. Buying Cisco then would have been a poor investment. Likewise, it’s hard to make the math work for Nvidia stock to perform well from its current level.
- Similarly, the info tech sector index is lofty now, at more than two standard deviations above its long-term trend line.
- We don’t know the future performance of AI. However, since leading AI companies and US information technology stocks in general have bubble-level prices, it is reasonable to be cautious.
In recent weeks, equity investors have been swept up in enthusiasm for the stocks of companies with Artificial Intelligence (AI) capabilities. The frenzy went into overdrive after the blockbuster May 25 earnings release of Nvidia, which has propelled the company to a market value in excess of $1 trillion, joining Apple, Microsoft, Alphabet (Google) and Amazon. Nvidia has been the most prominent beneficiary of the ongoing wave of investment in AI, for good reasons. It is the leading provider of the semiconductor/software infrastructure used for AI applications, and therefore well-positioned to profit as AI takes off. The stock prices of other companies with AI capabilities have soared as well.
As long-time residents of the San Francisco Bay Area, we can’t help getting a sense of déjà vu. Have we seen this before? The current Nvidia mania seems awfully similar to Cisco during the internet bubble period with a nearly identical argument: “the internet is going to change the world, and Cisco is the dominant supplier of the networking equipment to run the internet”. While we are not predicting the future of the Nvidia stock price, we thought it might be worthwhile to offer some interesting parallels, and investors can draw their own conclusions.
Recurring Enthusiasm for New Technologies
Stock market history is full of examples of investors getting carried away investing in new and promising technologies. This phenomenon was chronicled way back in 1841 in the book “Extraordinary Popular Delusions and the Madness of Crowds.” Usually, investors were correct in thinking that a new technology had exceptional potential. Developments such as railroads, automobiles, radio, air travel, computers and the internet turned out to be important advances which led to thriving businesses. However, it has also often been the case that the early investors in these promising business ideas faced crushing losses until there was a weeding out of early entrants and the emergence of sustainable models to generate profits from the new technology.
Cisco during the dot-com bubble

Cisco was a dominant beneficiary of the tech bubble of the late 1990’s, becoming the second most valuable company in the world by the end of 1999, trailing only Microsoft. The reasons to invest in Cisco were good ones as we discussed earlier, and in reality, Cisco continued to be critically important to the development of the new internet economy in the decades since. During the decade from March 1990 to March 2000, the Cisco stock price returned nearly 100% per year on average, resulting in a price to sales ratio of 42x at its peak, the same price to sales as Nvidia today.
As a cautionary tale, investors who bought Cisco when it had a price to sales ratio of 42x fared badly. In the next 18 months, they lost 84%. Although Cisco eventually recovered from its lows, investors who bought at the peak of the tech bubble have gone a generation without making any money. The stock price today is $52, which is slightly lower than the peak of $56 reached in March 2000. The stock did not gain over 23 years despite Cisco’s sales per share and earnings per share continuing to grow more than 10% per year, on average. Investors in 2000 simply paid too much for a great company. The 91% decline in the price/sales ratio from 42 to a more sustainable 3.9 today has been the main obstacle to obtaining a positive investment return.
Eye-Popping Valuations for Nvidia

With Nvidia’s enviable rise in the last 2 years, the FOMO is real. But is it a good investment at $430 per share? It is very rare for a large company to trade at a price to sales as high as 42. Currently, there is no other company in the S&P 500 which trades at a price to sales ratio of more than 18x. The weighted average price/sales for all the companies in the S&P 500 is only 2.5x now, and it has usually been below 2x. That 42x price/sales for Cisco in March 2000 is the only other instance we could find in recent decades where one of the top companies by market value also had a price to sales over 40.
Hard to make the math work for Nvidia
Since the market value of Nvidia is $1.06 trillion now, it would need to be $2.75 trillion in June 2033 to generate a 10% annual return for investors. Since 1996, the median price/sales ratio of the US information technology sector has been 3x. If the price/sales ratio for Nvidia is 3x in 2033, annual revenues would need to be $915 billion dollars for the valuation to reach $2.75 trillion. Nivida’s annual revenues are estimated at $43 billion for 2024. Revenues would have to compound at 41% per year for the following nine years to get to $915 billion by 2033.
That 41% is an unlikely revenue growth rate for a large company. None of the most successful companies of our time managed anything like that. Apple grew revenues 22% per year in the nine years after exceeding $40 billion in sales, while Amazon grew 26%, Alphabet (Google) grew 21% and Microsoft grew 9%. While Nvidia might beat the odds, it would be unprecedented to do so. It is simply hard for any company, particularly a very large company, to grow fast enough to justify such a stratospheric price to sales. An analysis by Trivariate Research of all non-financial companies with revenues over $50 million which reached a price to sales of over 36x concluded that the average subsequent return of those companies over the next 2 – 3 years was about 25% behind the S&P 500[1].
It’s not just Nvidia
C3.ai, Inc., a maker of AI software for enterprise optimization, has the double benefit of having “AI” in its name and “AI” as a stock ticker. The stock price has quadrupled from $11 to $44 since December (versus a mere tripling for Nvidia), and the price/sales ratio is now a lofty 18. Microsoft (up 43% this year) and Alphabet (+40%), have participated in the AI boom, as well as the leading semiconductor companies Taiwan Semiconductor Manufacturing (+42%) and Broadcom (+56%), the AI data mining company Palantir (+154%) and the AI supply chain automation company Symbotic (+329%).
Bubble Levels for InfoTech
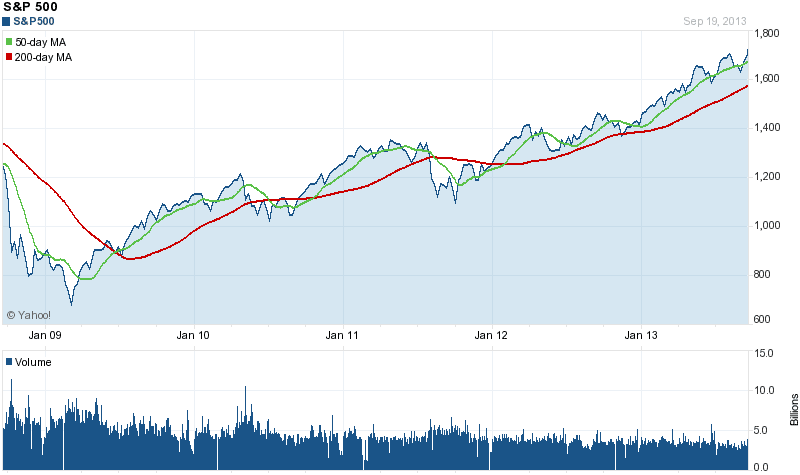
The asset management firm GMO defines a stock market bubble as a market which is priced more than two standard deviations above the long-term trend[2]. By this definition, the US Information Technology sector (and its software and semiconductor sub-sectors) are in a bubble today. The chart below shows the price of the US information technology sector[3] in blue, the long-term trend in green and the “bubble line,” two standard deviations above trend, in red. One can observe that the price of US InfoTech exceeded the bubble line in 2021, fell below it last year and has recovered back to bubble territory recently.

According to GMO, every stock market bubble has burst. Moreover, the bubble correction has always eventually brought the price back down through the trend line. For instance, in the 1990’s technology bubble, the price went well over the bubble line and then corrected back below trend by 2002. The Information Technology index, whose three largest companies are Apple, Microsoft and Nvidia, would have to fall 40% to get back to the trend line today.
No Conclusion Conclusion
We do not have special expertise regarding the future business opportunities of Artificial Intelligence. It could be that the scale of those opportunities will justify the prices being paid now for Nvidia and the other prominent AI companies. Even if those opportunities eventually fall below expectations, the current AI stock surge could still have more room to run. Nonetheless there are almost no prior examples of very large companies with the kind of extremely elevated valuation metrics that Nvidia has now. The past instances we know of did not turn out well for investors. And based on the GMO research about stock market bubbles, US information technology stocks have reached bubble-level prices again and therefore it is reasonable to be cautious about the outlook for the large technology stocks.
Footnotes
- Adam S. Parker, Trivariate Research, Level Set – Upward Revisions and The Lack of NVDA Valuation Precedents
- The standard deviation is a measure of how much the price can move in a year. It is 25% for US Information Technology, which means 2 standard deviations is a price 50% over trend.
- Source: Bloomberg, S5INFT Index
PHOTO CREDIT: https://www.shutterstock.com/g/Andrey+Suslov
Via SHUTTERSTOCK
DISCLOSURE
Investing involves risk, including the possible loss of principal. Diversification does not ensure a profit nor guarantee against a loss.
This material represents an assessment of the market environment at a specific point in time and is not intended to be a forecast of future events, or a guarantee of future results. This information is not intended to be individual or personalized investment or tax advice and should not be used for trading purposes. Please consult a financial advisor or tax professional for more information regarding your investment and/or tax situation.
Atlas Capital Advisors is an independent, fee-only investment advisor dedicated to providing unbiased advice to our clients. Our specialty is designing and managing sophisticated, tax-sensitive portfolios based on a quantitative and academically-rigorous investment process. We serve affluent individuals, families, trusts, foundations, and privately held businesses. As a fiduciary, we always act in your best interest. At the time of publishing, the author does not own any of the stocks mentioned in the article
Investors cannot invest directly in an index. The MSCI USA Information Technology Index is designed to capture the large and mid cap segments of the US equity universe. All securities in the index are classified in the Information Technology sector as per the Global Industry Classification Standard (GICS®).
