By: Madeline Ruid
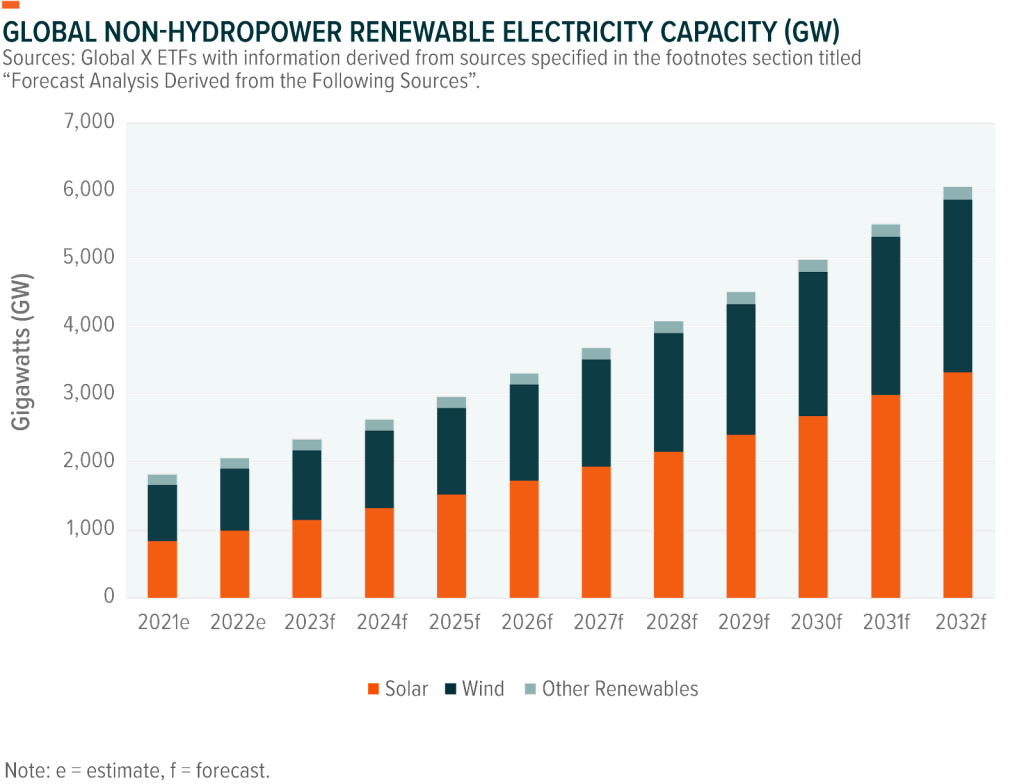
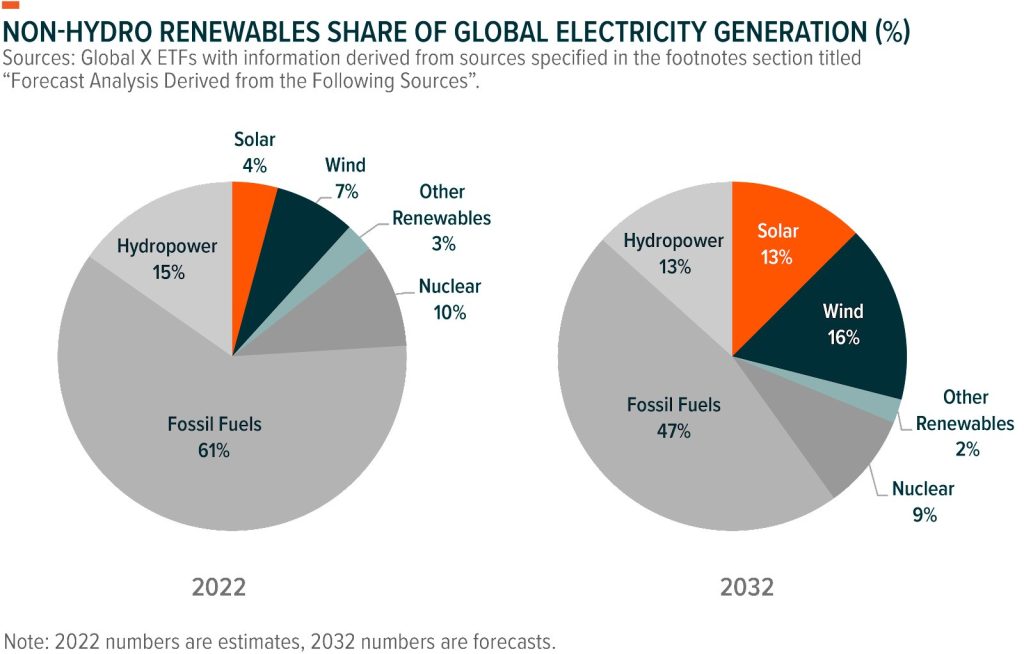
The adoption of renewable energy is accelerating, particularly wind and solar power, as governments and corporations ramp up decarbonization efforts to minimize the impacts of climate change. We forecast global non-hydro renewables electricity capacity could increase threefold from 2023 to 2032.1 By 2032, non-hydro renewables could account for nearly one-third of the world’s total power generation.2 In this report, we explore the factors supporting our robust growth outlook and the significant investment opportunities that could emerge as a result.
Key Takeaways
- The non-hydro renewables sector is likely to grow significantly over the coming decade amid an increasingly supportive government policy landscape.
- Corporate sustainability efforts, continued technology advancements, and renewable energy systems’ cost competitiveness also support the strong growth outlook.
- The wind and solar power segments are likely to remain the renewable energy technologies of choice, presenting opportunities for companies across the wind and solar power value chains.
Supportive Policy, Superior Tech Bolster Renewables’ Growth Outlook
We forecast global non-hydropower renewable electricity capacity could grow 195% over the coming decade, increasing from an estimated 2,064 gigawatts (GW) at year-end 2022 to 6,060GW in 2032.3 Subsequently, non-hydro renewables’ share of global electricity generation could increase from an estimated 14% share in 2022 to a notable 31% share in 2032.4
Robust government policies underpin the strong growth outlook. Nearly 135 countries have economy-wide net zero emissions targets.5 Many national and sub-national governments also have specific renewable energy targets. To incentivize renewable energy growth and to meet these targets, governments are offering a range of subsidies, grants, feed-in-tariffs, renewables auctions, and project tenders.
The Inflation Reduction Act is a prime example, as it extends and expands clean energy tax credits, which are expected to provide significant tailwinds for renewable energy growth in the U.S.6 Additional evidence of supportive policy’s positive effects is the nascent U.S. offshore wind industry, which is beginning to take off due to a range of recent policy efforts at the state and federal levels.
In the private sector, some corporations even want their own renewable energy supply to meet sustainability targets, including onsite. For example, Ikea has rooftop solar systems on nearly all its buildings.7 However, the most common procurement avenue for corporations is through power purchase agreements (PPAs) with a renewable energy generator that owns and operates the renewable energy project.8 PPAs provide corporations an avenue for reducing emissions without directly building clean power facilities. The United States has the most active PPA market, where over 300 corporations contracted a record-high 20GW of renewable energy capacity in 2022.9 Technology companies, including Amazon, Google, and Meta, have contracted the largest cumulative PPA capacities over the past decade.10
Further supporting the robust growth outlook are expectations for continued advancements in clean energy technologies. Improvements to renewable energy system components such as solar modules and wind turbines are likely to expand the suitability range and performance of systems. Importantly, more powerful solar modules and wind turbines can reduce the amount of equipment needed for a project, potentially cutting land, labor, and construction costs.
Also, advancements in floating solar panel systems and floating offshore wind power technologies are likely to expand the areas where projects can be built, which could be particularly beneficial in land-scarce countries. At the same time, advancements and growth in energy storage should allow for the proliferation of high shares of renewable energy on electrical grids.
Wind and Solar Power Economics Create Growth Opportunities
Wind and solar power are likely to remain the renewable technologies of choice given their scalability, improving technology, and increasing affordability. In particular, cost competitiveness of renewable energy systems contributes to the significant interest by governments, corporations, and residential energy users.
Onshore wind and solar photovoltaic (PV) power costs declined by 68% and 88%, respectively, between 2010 and 2021 due to technology advancements and economies of scale.11 Supply chain challenges increased wind and solar power prices over the past year, but both remain highly cost competitive, given often steeper cost increases to natural gas prices.12
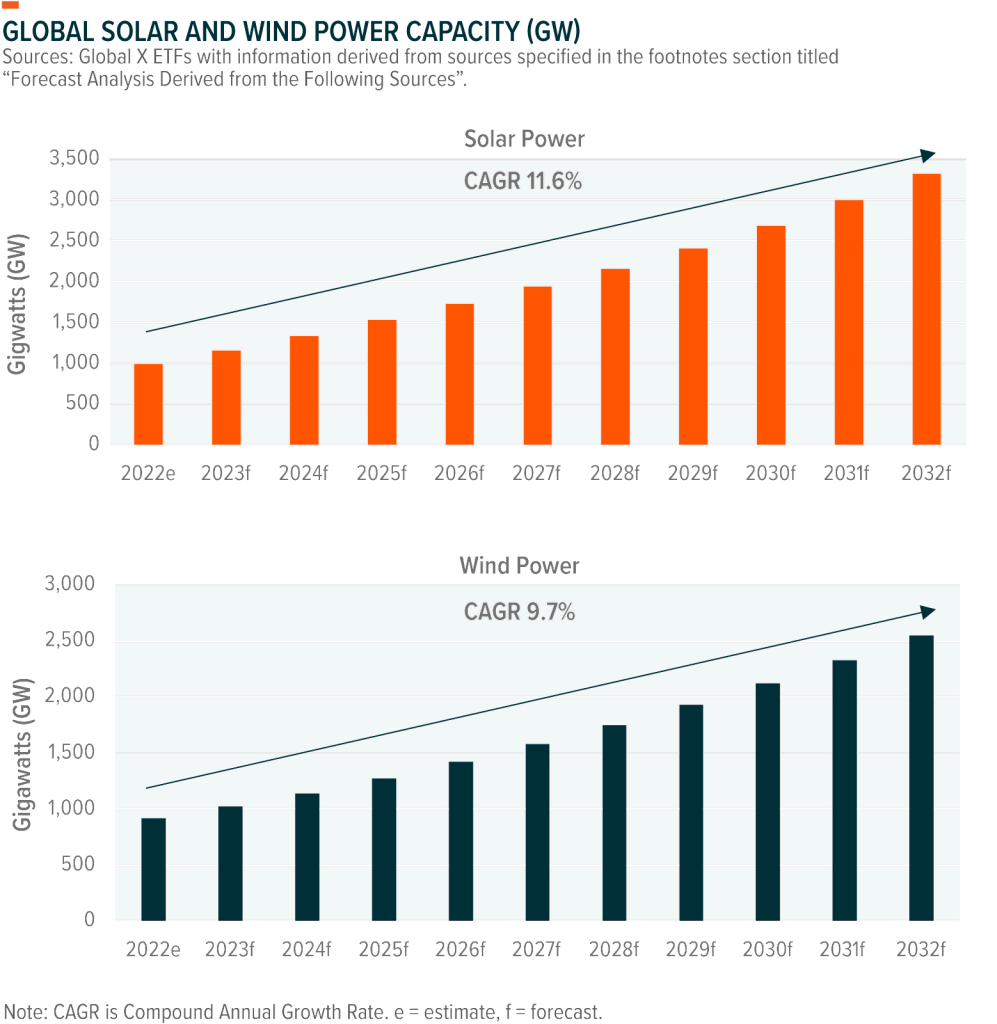
Combined, these attributes position the solar and wind segments for significant capacity growth. We forecast the two sectors could account for nearly 88% of total capacity growth worldwide over the next decade, well in excess of forecasted capacity growth by other sources such as fossil fuels and other renewables.13 Over the next 10 years, solar power capacity could grow at a compound annual growth rate (CAGR) of 11.6% and global wind power capacity could yield a CAGR of 9.7%.14
Conclusion: Renewables Offer Transformative Growth Potential
Global investments into renewable energy reached a new record high of $495 billion in 2022, a 17% increase from 2021.15 We expect renewable energy investments to continue to climb as the energy transition picks up. As investments increase, substantial opportunities are likely to emerge for renewables companies, particularly those across the solar and wind power value chains. Equipment manufacturers of solar power modules, cells, inverters, wafers and tracking systems, wind turbine manufacturers, and wind and solar project developers and asset owners, all have the potential to benefit. Over time, we expect these players to turn the power sector green, and in the process create compelling opportunities for investors to participate.
1. Global X ETFs Analysis derived from a variety of sources. See ‘Forecast Analysis Derived from the Following Sources’ footnote below for the full list.
2. Ibid.
3. Ibid.
4. Ibid.
5. Net Zero Tracker. (n.d.). Net Zero Tracker: Net Zero Numbers. Accessed on February 8, 2023.
6. The Inflation Reduction Act of 2022, H.R. 5376, 117th Cong. (2022).
7. Curbed. (2022, May 24). Solar Panels Are Coming To Ikea.
8. American Clean Power. (2023, January 18). Clean Energy Powers American Business.
9. Ibid.
10. Ibid.
11. International Renewable energy Agency (IRENA). (2022, July 13). Renewable Power Generation Costs in 2021.
12. International Renewable Energy Agency (IRENA). (2022, July 13). Renewable Power Remains Cost-Competitive amid Fossil Fuel Crisis.
13. Global X ETFs Analysis derived from variety of sources. See ‘Forecast Analysis Derived from the Following Sources’ footnote below for full list.
14. Ibid.
15. BloombergNEF. (2023, January 26). Global Low-Carbon Energy Technology Investment Surges Pst $1 Trillion for the First Time.
Forecast Analysis Derived from the Following Sources
1. Absolar. (2022, October 5). Panorama of solar photovoltaic in Brazil and in the world.
2. China Energy Portal. (2022, January 27). 2021 electricity & other energy statistics (preliminary).
3. Empresa de Pesquisa Energética (EPE). (n.d.). Pde 2031 – English version. Accessed on November 15,
4. Energy-Charts. (2022, October 31). Net installed electricity generation capacity in Germany in 2022. Fraunhofer.
5. Fitch Solutions. (n.d.). Infrastructure key projects data. Accessed on November 15, 2022.
6. Ministry of Economy, Trade and Industry (METI). (2022, February 25). Japan’s energy. Agency for Natural Resources and Energy.
7. Ministry of Power (GOI). (2022, March 29). Annual report 2021 – 22.
8. Ministry of Economy, Trade and Industry (METI). (2021, November 26). Outline of strategic energy plan. Agency for Natural Resources and Energy.
9. Energy.gov. (2022, September 12). Offshore wind market report: 2022 edition.
10. Caron Brief. (2022, May 3). China policy: Analysis: What do China’s gigantic wind and solar bases mean for its climate goals?
11. Ministry of Power (GOI). (2022, October 19). Power sector at a glance all India.
12. Rosatom. (2022, September 15). NovaWind proceeds to installation of wind turbines at Kuzminskaya wind farm in Stavropol krai.
13. U.S. Energy Information Administration (EIA). (n.d.). International: Data. Accessed on November 15, 2022.
14. U.S. Energy Information Administration (EIA). (2022, October 25). Electricity: Preliminary monthly electric generator inventory (based on form EIA-860m as a supplement to form EIA-860).
15. Whitlock, R. (2022, July 8). Panorama: Germany approves largest renewable energy expansion plan in history. Renewable Energy Magazine.
Originally Posted February 22nd, 2023, GlobalX
PHOTO CREDIT:https://www.shutterstock.com/g/Ph.wittaya
Via SHUTTERSTOCK
Disclosure
Investing involves risk, including the possible loss of principal. Diversification does not ensure a profit nor guarantee against a loss. Narrowly focused investments will be more susceptible to factors affecting that sector and subject to more volatility. These companies typically face intense competition, short product life cycles and potentially rapid product obsolescence. These companies may be significantly affected by fluctuations in energy prices and in the supply and demand of renewable energy, tax incentives, subsidies and other governmental regulations and policies. International investments may involve risk of capital loss from unfavorable fluctuation in currency values, from differences in generally accepted accounting principles or from social, economic or political instability in other nations. Emerging markets involve heightened risks related to the same factors as well as increased volatility and lower trading volume.
Investments in yieldcos involve risks that differ from investments in traditional operating companies, including risks related to the relationship between the yieldco and the company responsible for the formation of the yieldco. Yieldco securities can be affected by expectations of interest rates, investor sentiment towards yieldcos or the energy sector. Yieldcos may distribute all or substantially all of the cash available for distribution, which may limit new acquisitions and future growth. Yieldcos may finance its growth strategy with debt, which may increase the yieldco’s leverage and the risks associated with the yieldco. The ability of a yieldco to maintain or grow its dividend distributions may depend on the entity’s ability to minimize its tax liabilities through the use of accelerated depreciation schedules, tax loss carryforwards, and tax incentives.
This material represents an assessment of the market environment at a specific point in time and is not intended to be a forecast of future events, or a guarantee of future results. This information is not intended to be individual or personalized investment or tax advice and should not be used for trading purposes. Please consult a financial advisor or tax professional for more information regarding your investment and/or tax situation.