

By: Catherine Yoshimoto Director, Product Management, FTSE Russell
Friday, June 24 was our annual recon day, where we recalibrated the Russell US index family to accurately reflect the current state of the US equity market. And while Russell Index performance since last year’s recon told the story of inflation fears, when it came to index composition changes the biggest stories were about the biggest companies.
A tale of two tech giants
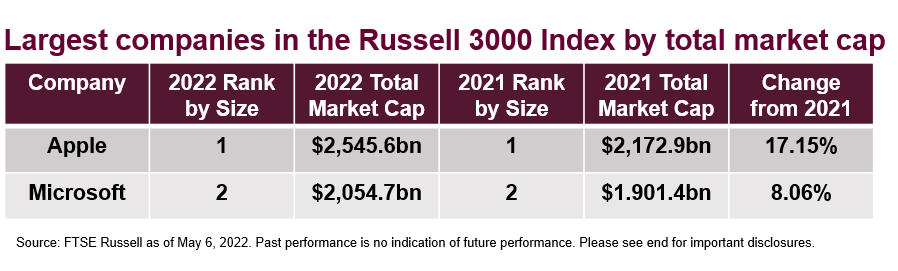
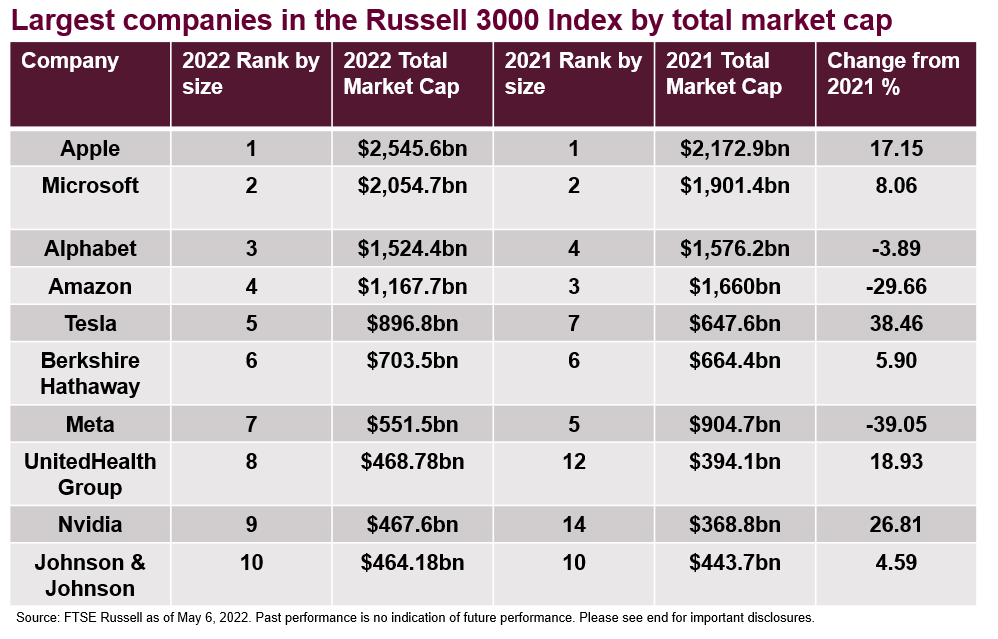
For the first time since 2019, the largest five Russell 3000 companies by market cap reshuffled their size rankings. While Apple and Microsoft held last year’s spots as the first and second largest companies respectively, Apple widened its lead with an increase in market cap of 17.15% compared with Microsoft’s increase of 8.06%.
However, despite falling to a more distant second place, Microsoft reached an important milestone of its own. The tech giant joined Apple in having a total market cap of over $2 trillion—the first time ever that multiple companies have broken this threshold.
Tesla’s battery-charged rise
In a stark about-face from the previous year, US equity markets haven’t fared well since last year’s recon. Representing the US broad market, the total market capitalization of the Russell 3000 Index decreased by 5.9%, down from $47.7 trillion in 2021 to $44.9 trillion in 2022. In effect, the breakpoint between large cap and small cap decreased by 11.5% from $5.2 billion last year to $4.6 billion for 2022.
While the Russell Indexes have performed in negative territory over the past year, the majority of the ten largest companies outperformed the broader indexes. Seven of the top 10 companies in the Russell 3000 Index increased their total market caps from 2021, but no increase was quite so pronounced as Tesla’s.
We added Tesla to the Russell 3000 just three months after its June 2010 IPO—a full decade before the electric vehicle company became consistently profitable. Our indexes have since tracked its high-flying journey to the ranks of US equity mega caps, including the period since last year’s reconstitution. During this time, Tesla’s market cap soared 38.46%, propelling it to a spot among the top five largest companies.
As shown, in its rise Tesla leapfrogged Berkshire Hathaway—which held its place as the sixth largest company—and Meta, which slipped from the fifth to the seventh largest company after its market cap sunk -39.05% for the year.
Meta is no longer just a growth company
Meta’s declining position among the mega caps wasn’t the company’s only noteworthy 2022 recon story. After a long run as a 100% growth company, in this year’s recon Meta shifted to 79% growth and 21% value, making it the largest addition to the Russell 1000 Value Index by both size and weight.
Meta’s partial shift to value was based on a number of metrics, including price-to-book ratios, growth forecasts, and historical sales. Our multivariable ranking process determined that Meta was value-oriented relative to other stocks in the Russell 1000, and we assigned its weight in the value index accordingly.
Capturing the big company stories on recon day
As we’ve said time and time again, an index is only useful to the extent that it accurately reflects the market it’s designed to represent. The US equity markets are ever-changing, and this past year has made for some particularly headline-worthy stories for a few of the largest US companies. When these changes happen among the mega caps, it’s important that our indexes capture them—and our annual Russell recon is key to ensuring that they do.
Please see our summary of final 2022 recon changes for more details.
This post first appeared on July 8th 2022, FTSE Russell Blog
PHOTO CREDIT: https://www.shutterstock.com/g/tanaonte
Via SHUTTERSTOCK
© 2022 London Stock Exchange Group plc and its applicable group undertakings (the “LSE Group”). The LSE Group includes (1) FTSE International Limited (“FTSE”), (2) Frank Russell Company (“Russell”), (3) FTSE Global Debt Capital Markets Inc. and FTSE Global Debt Capital Markets Limited (together, “FTSE Canada”), (4) FTSE Fixed Income Europe Limited (“FTSE FI Europe”), (5) FTSE Fixed Income LLC (“FTSE FI”), (6) The Yield Book Inc (“YB”) and (7) Beyond Ratings S.A.S. (“BR”). All rights reserved.
FTSE Russell® is a trading name of FTSE, Russell, FTSE Canada, FTSE FI, FTSE FI Europe, YB and BR. “FTSE®”, “Russell®”, “FTSE Russell®”, “FTSE4Good®”, “ICB®”, “The Yield Book®”, “Beyond Ratings®” and all other trademarks and service marks used herein (whether registered or unregistered) are trademarks and/or service marks owned or licensed by the applicable member of the LSE Group or their respective licensors and are owned, or used under license, by FTSE, Russell, FTSE Canada, FTSE FI, FTSE FI Europe, YB or BR. FTSE International Limited is authorized and regulated by the Financial Conduct Authority as a benchmark administrator.
All information is provided for information purposes only. All information and data contained in this publication is obtained by the LSE Group, from sources believed by it to be accurate and reliable. Because of the possibility of human and mechanical error as well as other factors, however, such information and data is provided “as is” without warranty of any kind. No member of the LSE Group nor their respective directors, officers, employees, partners or licensors make any claim, prediction, warranty or representation whatsoever, expressly or impliedly, either as to the accuracy, timeliness, completeness, merchantability of any information or of results to be obtained from the use of FTSE Russell products, including but not limited to indexes, data and analytics, or the fitness or suitability of the FTSE Russell products for any particular purpose to which they might be put. Any representation of historical data accessible through FTSE Russell products is provided for information purposes only and is not a reliable indicator of future performance.
No responsibility or liability can be accepted by any member of the LSE Group nor their respective directors, officers, employees, partners or licensors for (a) any loss or damage in whole or in part caused by, resulting from, or relating to any error (negligent or otherwise) or other circumstance involved in procuring, collecting, compiling, interpreting, analyzing, editing, transcribing, transmitting, communicating or delivering any such information or data or from use of this document or links to this document or (b) any direct, indirect, special, consequential or incidental damages whatsoever, even if any member of the LSE Group is advised in advance of the possibility of such damages, resulting from the use of, or inability to use, such information.
No member of the LSE Group nor their respective directors, officers, employees, partners or licensors provide investment advice and nothing in this document should be taken as constituting financial or investment advice. No member of the LSE Group nor their respective directors, officers, employees, partners or licensors make any representation regarding the advisability of investing in any asset or whether such investment creates any legal or compliance risks for the investor. A decision to invest in any such asset should not be made in reliance on any information herein. Indexes cannot be invested in directly.Inclusion of an asset in an index is not a recommendation to buy, sell or hold that asset nor confirmation that any particular investor may lawfully buy, sell or hold the asset or an index containing the asset. The general information contained in this publication should not be acted upon without obtaining specific legal, tax, and investment advice from a licensed professional.
Past performance is no guarantee of future results. Charts and graphs are provided for illustrative purposes only. Index returns shown may not represent the results of the actual trading of investable assets. Certain returns shown may reflect back-tested performance. All performance presented prior to the index inception date is back-tested performance. Back-tested performance is not actual performance, but is hypothetical. The back-test calculations are based on the same methodology that was in effect when the index was officially launched. However, back-tested data may reflect the application of the index methodology with the benefit of hindsight, and the historic calculations of an index may change from month to month based on revisions to the underlying economic data used in the calculation of the index.
This document may contain forward-looking assessments. These are based upon a number of assumptions concerning future conditions that ultimately may prove to be inaccurate. Such forward-looking assessments are subject to risks and uncertainties and may be affected by various factors that may cause actual results to differ materially. No member of the LSE Group nor their licensors assume any duty to and do not undertake to update forward-looking assessments.
No part of this information may be reproduced, stored in a retrieval system or transmitted in any form or by any means, electronic, mechanical, photocopying, recording or otherwise, without prior written permission of the applicable member of the LSE Group. Use and distribution of the LSE Group data requires a license from FTSE, Russell, FTSE Canada, FTSE FI, FTSE FI Europe, YB, BR and/or their respective licensors.
Indexes cannot be invested in directly. The Russell 3000® Index measures the performance of the largest 3,000 US companies representing approximately 97% of the investable US equity market. The Russell 1000® Value Index measures the performance of the large cap value segment of the US equity universe. It includes those Russell 1000 companies with relatively lower price-to-book ratios, lower I/B/E/S forecast medium term (2 year) growth and lower sales per share historical growth (5 years). The index is completely reconstituted annually to ensure new and growing equities are included and that the represented companies continue to reflect value characteristics .The Russell 1000® Index measures the performance of the large-cap segment of the US equity universe. . It is a subset of the Russell 3000® Index and includes approximately 1,000 of the largest securities based on a combination of their market cap and current index membership. The Russell 1000 represents approximately 93% of the US market. The Russell 1000® Index is constructed to provide a comprehensive and unbiased barometer for the large-cap segment and is completely reconstituted annually to ensure new and growing equities are included.
