

By: Morgane Delledonne, GlobalX
Two opposing forces appear to be dominating the market currently, with investors polarized between recession fears and bargain hunting following this year’s large equity selloff. As a result, demand for safe haven and defensive assets like U.S. Treasuries increased in the past month, and cheaply valued tech stocks rebounded. Notable was the bounce back in biotech stocks, including the Solactive Genomics v2 Index, which increased 24% over the last month as of 15 July.1
Developed market sovereign yield curves flattened significantly in the past month, with the long end shifting downwards by about 40 basis points (bps), reflecting rising recession risk. The divergence in monetary policy between North America and Europe became more tangible and resulted in the euro dropping below parity with the U.S. dollar on July 14. U.S. headline inflation surprised by strongly overshooting expectations, coming at 9.2% yoy in June, but the core inflation print pointed in a more favorable direction, as it slowed to 5.9% yoy from 6.0% yoy in May.2
The overshoot in headline inflation resulted in a short-lived selloff on July 13 followed by a rebound led by tech companies. U.S. Treasury yields ended that session lower, suggesting that recession fears now exceed inflation risk and market participants are not fully convinced the Federal Reserve (Fed) will overreact to this print. Markets now expect the Fed to quicken its tightening pace, but the end fed funds rate is little changed and still expected to peak at 3.5% in December 2022 or January 2023. Overall, this outlook is supportive for tech stocks, which are typically sensitive to interest rates, as the risk of another rate shock has declined significantly.
Investment strategies highlighted this month:
- Recession Fears Exceed Inflation Risk – Investors priced in most central bank tightening and seem more confident with the inflation outlook as oil prices decline, to the benefit of tech stocks. As the second half unfolds and recessions fears mount, we believe themes that can reduce risk profile of thematic sub portfolios include Telemedicine & Digital Health, Cybersecurity, Internet of Things, and Renewables.
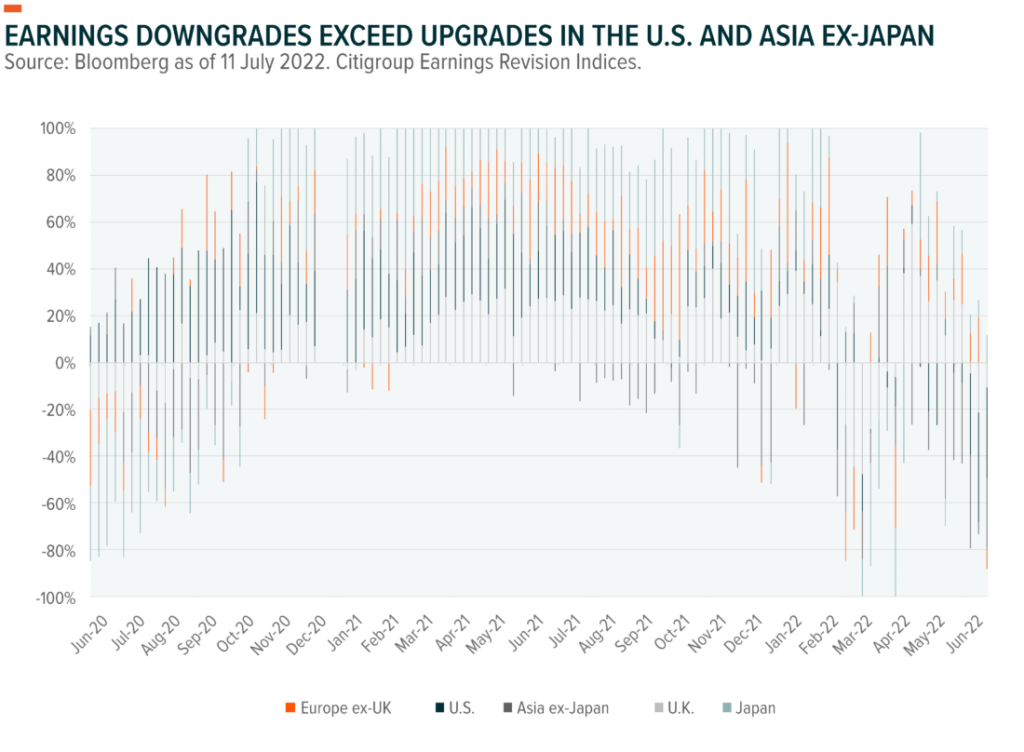
- All Eyes on Q2 Earnings – Earnings downgrades exceed upgrades in the U.S. and Asian ex-Japan, possibly leading to more vulnerabilities in the second half. This dynamic signals a rotation to defensive strategies and diversification.
- The EU Shifts Greener – The clean energy transition in Europe is accelerating, supported by new green policies from the European Central Bank (ECB) and the EU Parliament voting to label natural gas and nuclear power as green investments. As a result, we expect opportunities in the ESG market in Europe to increase.
Investor Sentiment: Recession Fears Mount, Overtake Inflation Risk
U.S. inflation expectations moved lower in the second half of June before slightly bouncing back following the latest headline inflation data. The 5-year, 5-year USD inflation swap rate now hovers around 2.5%, down from 2.7% prior to the June Fed meeting. This decline should reduce pressures on the Fed to be more aggressive with its tightening than what is currently priced in the market.3 The Fed looks set for at least a 75bp fed funds rate increase following a strong jobs report and a new inflation peak in June.
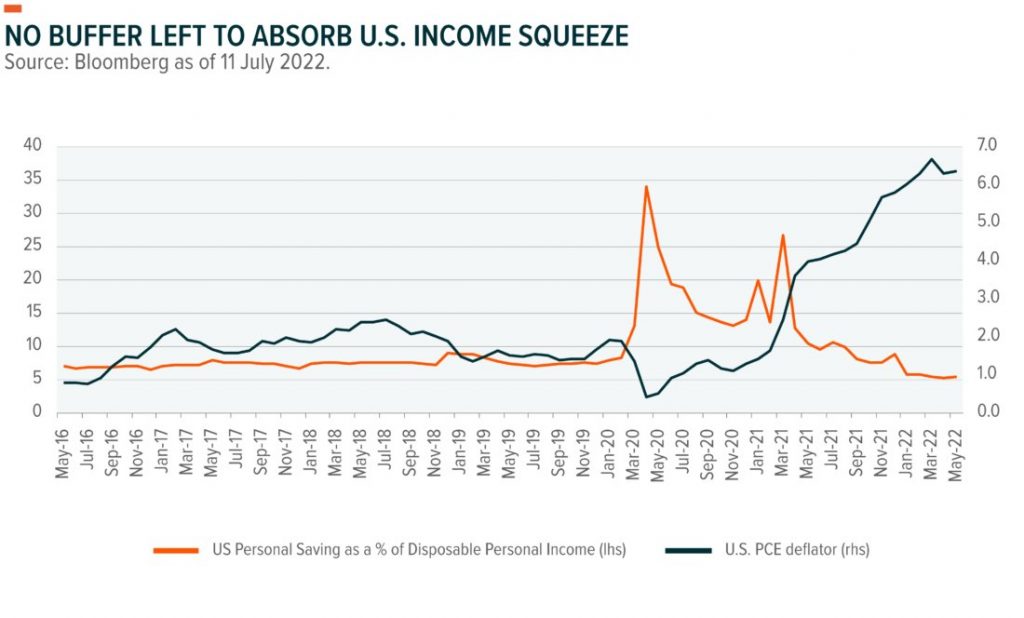
Energy and food inflation pushing higher in recent months has core and headline U.S. inflation measures diverging. In the second half, we look for headline inflation to start to moderate amid a decline in oil and commodity prices. Core inflation should also cool due to higher interest rates and a slowdown in demand. The second half might be harder for consumers than corporations, which could lead to gradually deteriorating outlooks for sectors like Real Estate, Consumer Discretionary, and Financials, given the higher costs of credits and increased risk of defaults. Thus far, significant saving buffers have absorbed the higher prices and allowed consumption to remain strong, but the graph below shows that buffer is depleted.
The risk of a recession in the U.S. increases toward year-end, as higher rates are likely to dampen the housing market and credit consumption. However, we still do not expect a recession this year, but rather more of a gradual slowdown over the next year.
We expect countries with high current account imbalances and net importers with weak currencies, like in Europe, to be the most vulnerable in the second half. With the euro now below parity with the dollar for the first time in two decades, Europe faces stronger headwinds with higher imported inflation. In the Eurozone and U.K., current account balances are deteriorating and recession risk is heightened, which reinforces the dollar’s strength versus the sterling and the euro. Higher costs of energy in Europe may eventually erode industrial profit margins and lead to temporary closures or delays in production. In contrast, the U.S. should benefit from a stronger dollar amid the rising appetite for safe haven assets like U.S. Treasuries. U.S. companies that export to the rest of the world are not without risk in this scenario, as a strong dollar would dampen their competitiveness, further clouding the global outlook, as demand is expected to slow down. Thus, U.S. industrials with an economic focus on the U.S. could prove more defensive than broader industrial exposure.
The Fed’s aggressive tightening contrasts with the ECB, which is expected to raise its key rate by only 25bps for the first time this month. This divergence in monetary policy will likely keep the euro lower, possibly below parity versus the dollar throughout the second half. In our view, a recession in Europe is more likely before a recession in the U.S. given higher energy costs and their weight on investor sentiment. In Germany, for example, the ZEW institute’s gauge of investor confidence in current economic conditions fell to its lowest level since 2011. Germany faces the growing prospect of a recession and mounting risks that Russia will cut its gas supplies, which are already down 60% due to the partial closure of the Russian Nord Stream One pipeline for annual maintenance.4
Q2 Earnings: Investors Looking for Cues
More turbulence is likely to come from downward revisions in earnings expectations through the end of 2022 and into 2023. The risk of selloff in the second half of this year will likely come from deteriorating economic conditions rather than another central bank-induced rate shock. Investors will eye companies’ guidance for cues on whether inflation and higher rates can lead to a V-shaped recession or more of a soft landing, possibly from 2023 onwards.
Earnings downgrades exceed upgrades in the U.S. and Asia ex-Japan, which could lead to further volatility and downside risk for broad equity benchmarks in these regions in Q3. European stocks have sold off more than their U.S. counterparts since the beginning of the year, with their valuations already discounted for recession risks.
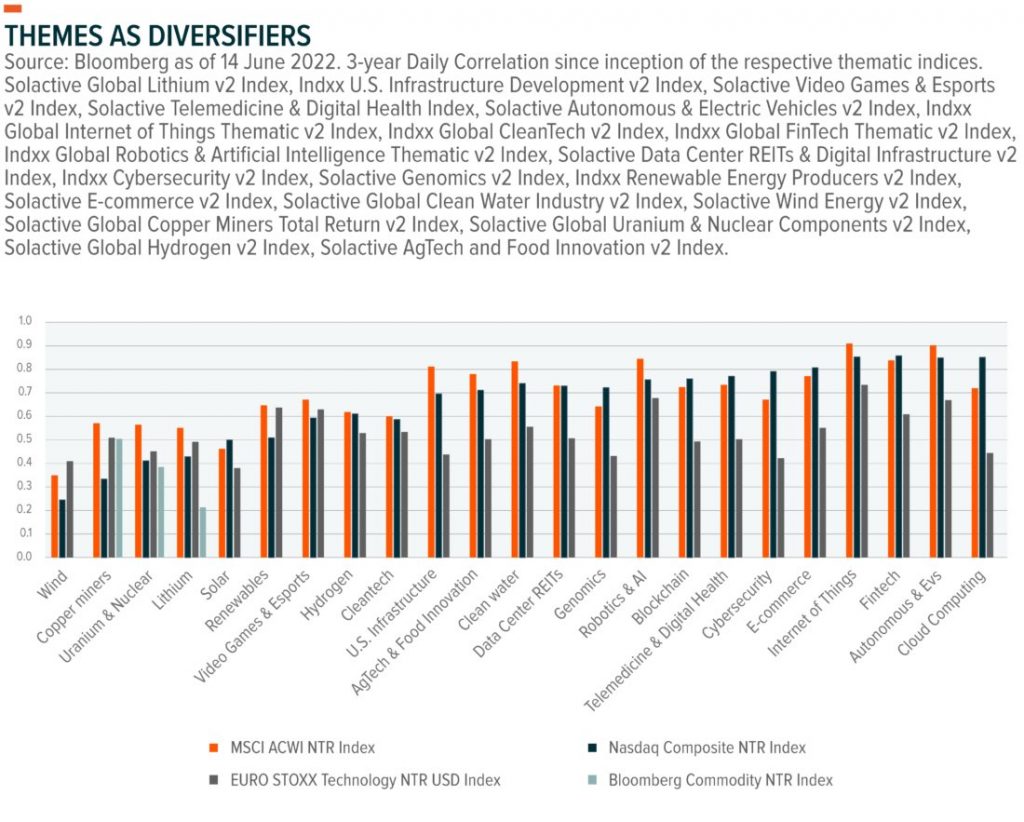
Given these economic risks and the market volatility, many investors are looking at diversification and defensive strategies. Beyond the traditional defensive asset classes, certain themes combine value in the aftermath of the tech selloff and diversification, as the chart below illustrates.
For example, in recent weeks, the Biotech, Cloud, and Telemedicine & Digital Health themes are among the best performers in the thematic space, and they appear attractively valued. These themes are also more defensive because of the healthcare exposures for Biotech and Telemedicine & Digital Health, and they can be inflation hedges given the subscription business model of cloud companies (see Investment Strategy Monthly Insights, May 2022 – GXEU (globalxetfs.eu)). In addition, Biotech and Telemedicine & Digital Health offer diversification benefits given their broader healthcare exposures. Biotech’s 3-year daily correlation with the MSCI World Healthcare Index is 0.54 and Telemedicine & Digital Health’s is 0.64.5
A Greener EU: Energy fragmentation in Europe Forces the EU to Act
Several days after the ECB’s 4th of July announcement that it would tilt its corporate bond portfolio to companies with better climate performance, the EU Parliament voted to allow natural gas and nuclear energy to be labeled as green investments. This designation is a strong tailwind for sustainable investments and clean energy transition themes, as it will unlock significant funding, especially in Europe’s nuclear sector as a crucial substitute for Russian fossil fuels. These green shifts are expected to begin next year, in tandem with the full implementation of the EU’s embargo on Russian oil.
With these actions, the EU sent a clear signal to investors about its adaptability: It will move to reduce the region’s energy vulnerability, including to protect against possible retaliations and severe natural gas cuts from Russia. The EU’s move toward sustainability is not only an environmental decision but also a clear economic and strategic priority. For investors, these actions will likely deepen the European ESG market with greater opportunities in cleantech, renewable energies, and uranium over the medium and long terms.
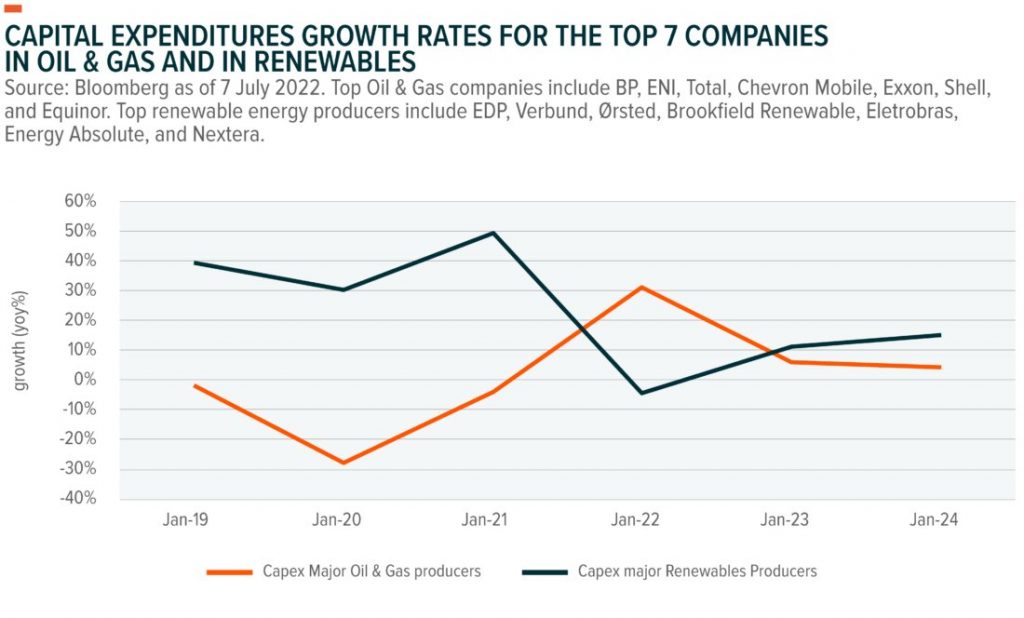
The effects of Europe’s clean transition are already visible, reflected in stagnant capital expenditures from the major oil & gas companies, in contrast to the double-digit growth in investments from top renewable energy producers. Companies like Ørsted, a world leader in offshore wind based in Denmark, and EDP, a leading renewable energy company based in Portugal, are examples. In Europe, most investments from major energy companies are increasingly geared toward non-oil & gas business. Approximately 15% of capital expenditures is expected to support the green transition this year. By 2030, the percentage is expected to be over 50% according to Bloomberg analyst forecasts.6
Globally, the green transition is less evident, leading to diverging sentiments about clean energy ETFs. Following Russia’s invasion of Ukraine, net inflows into climate change-related themes in Europe totaled over US$1.5bn from the end of February to the end of June. These massive inflows underline the shift in investor sentiment towards clean energy as a short-term economic and security priority amid the energy crisis that rages in Europe.7 In contrast, net inflows into those themes totaled only US$30mn in the U.S. over the same period, which suggests that sentiment among U.S. investors has shifted outside renewable energy themes in favor of fossil fuels amid rising oil prices.
Nonetheless, about US$28bn of assets is invested in climate change-related thematic ETFs globally, making it the largest mega-theme in terms of assets under management.8
—This post first appeared on July 19th 2022, GlobalX Blog
PHOTO CREDIT: https://www.shutterstock.com/g/whyframe
Via SHUTTERSTOCK
FOOTNOTES
1. Bloomberg as of 11 July 2022
2. U.S. Bureau of Labor Statistics
3. Bloomberg as of 15 July 2022
4. Factbox: Profile of the Nord Stream 1 gas link as it shuts for annual maintenance | Reuters
5. Global X ETFs calculations, data from Bloomberg as of 15 July 2022
6. Bloomberg as of 13 July 2022
7. Global X ETFs classification, data from Bloomberg as of 30 June 2022
8. Ibid.
Investing involves risk, including the possible loss of principal. International investments may involve risk of capital loss from unfavorable fluctuation in currency values, from differences in generally accepted accounting principles, or from economic or political instability in other nations. Emerging markets involve heightened risks related to the same factors as well as increased volatility and lower trading volume. Securities focusing on a single country and narrowly focused investments may be subject to higher volatility. The Global X International Access Suite Funds are non-diversified.
Shares of ETFs are bought and sold at market price (not NAV) and are not individually redeemed from the Fund. Brokerage commissions will reduce returns.
The value of an investment in ETFs may go down as well as up and past performance is not a reliable indicator of future performance.
Trading in ETFs may not be suitable for all types of investors as they carry a high degree of risk. You may lose all of your initial investment. Only speculate with money you can afford to lose. Changes in exchange rates may also cause your investment to go up or down in value. Tax treatment depends on the individual circumstances of each client and may be subject to change in the future. Please ensure that you fully understand the risks involved. If in any doubt, please seek independent financial advice. Investors should refer to the section entitled “Risk Factors” in the relevant prospectus for further details of these and other risks associated with an investment in the securities offered by the Issuer.
This material represents an assessment of the market environment at a specific point in time and is not intended to be a forecast of future events, or a guarantee of future results. This information is not intended to be individual or personalized investment or tax advice and should not be used for trading purposes. Please consult a financial advisor or tax professional for more information regarding your investment and/or tax situation.
Carefully consider the funds’ investment objectives, risks, and charges and expenses. This and other information can be found in the funds’ full or summary prospectuses, which may be obtained at globalxetfs.com. Please read the prospectus carefully before investing.
Global X Management Company LLC serves as an advisor to the Global X Funds.
Investors cannot invest directly into indexes. MSCI ACWI NTR Index, is designed to represent performance of the full opportunity set of large- and mid-cap stocks across 23 developed and 24 emerging markets. The NASDAQ Composite NTR Index is a market capitalization weighted index with more than 3000 common equities listed on the NASDAQ Stock Market. Bloomberg Commodity NTR Index, The Bloomberg Commodity Total Return index is composed of futures contracts and reflects the returns on a fully collateralized investment in the BCOM. This combines the returns of the BCOM with the returns on cash collateral invested in 13 week (3 Month) U.S. Treasury Bills. Euro Stoxx Technology NTR Index, The STOXX Supersector indices track supersectors of the relevant benchmark index. There are 20 supersectors according to the Industry Classification Benchmark (ICB). Companies are categorized according to their primary source of revenue. The following supersectors are available: Technology, Telecommunications, Health Care, Banks, Financial Services, Insurance, Real Estate, Automobiles and Parts, Consumer Products and Services, Media, Retail, Travel and Leisure, Food, Beverage and Tobacco, Personal Care, Drug and Grocery Stores, Construction and Materials, Industrial Goods and Services, Basic Resources, Chemicals, Energy, Utilities.
