By: Jon Maier,CIO, Global X
After the Federal Reserve (Fed) raised the fed funds target rate by 50 basis points (bps) in May, most market participants focused on the path of future rate hikes and their implications for financial assets and the broader economy. In the same Federal Open Market Committee (FOMC) meeting, Chair Jay Powell laid out the Fed’s plan to reduce its balance sheet, known as quantitative tightening (QT), to begin in June. The Fed’s balance sheet is one of the main determinants of the Fed funds target rate, and its importance has increased in the last decade.
QT Should Mean Higher Interest Rates and Tighter Financial Conditions
Since the Global Financial Crisis (GFC), the Fed has initiated four quantitative easing (QE) programs to stimulate the U.S. economy. QE serves two main purposes. 1) It increases demand for Treasuries, which lowers bond yields, and therefore risk-free interest rates in the broader economy. And 2) it increases reserves held by primary banks, which promotes lending and economic expansion. Therefore, by removing one of the largest buyers of Treasury and mortgage-backed securities, quantitative tightening should accomplish the opposite: higher interest rates and tighter financial conditions.
After completing the fourth tranche of QE in response to the COVID-19 pandemic, as of May 2022, the Fed’s balance sheet totaled $9 trillion. For perspective, before the GFC, it was less than $1 trillion. The assets on the balance sheet are primarily Treasury and mortgage-backed securities.
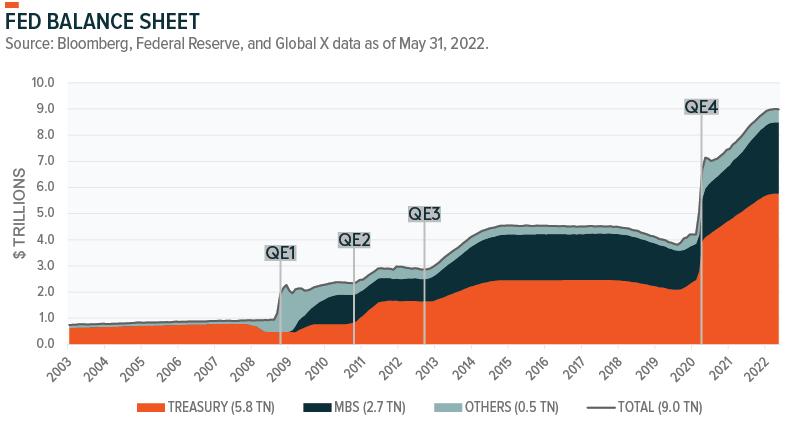
Starting June 1, the Fed began to let $47.5bn of securities—$30bn Treasuries and $17.5bn mortgage-backed securities—roll off per month until September, when it will ramp up to a total of $95bn per month.1 This pace is double that of the 2017–19 runoff.2 Powell estimated that a year’s worth of QT, or about $1 trillion, is roughly equivalent to a single 25bp rate hike.3 This estimate implies the massive expansion in the Fed’s balance sheet since the GFC translated to 200bps of total easing.
Does QT Lead to Higher Yields?
Typically, in isolation, yes. But in the current scenario, we don’t expect the reduction in the Fed’s balance sheet to be the main driver of Treasury yields over the next several months. Shorter-maturity Treasuries largely reflect the path of short rates, i.e., expectations of the pace and terminal rate of the Fed’s hiking cycle. Longer-dated Treasuries also incorporate the longer-term economic outlook as well as a risk premium, which includes supply and demand. The sell-off in Treasuries this year was mostly due to how quickly markets had to price in a Fed hiking cycle. Within six months, the Fed turned from zero expected hikes in 2022 to multiple officials calling for almost 250bps of hikes.4
With these expectations now priced in, we expect rates markets over the next several months to focus on inflation and growth dynamics. The direction of long-term Treasury yields will likely be dictated by whether the Fed’s aggressive tightening cycle induces a recession, and whether the Fed needs to preemptively end rate hikes or balance sheet reduction.
We also highlight the importance of risk premium in Treasury yields. Central banks around the world implemented QE, and global fixed income yields trended lower for the past decade, leaving investors to seek sources of long duration yield. Large holders of Treasuries include global central banks, commercial banks, and asset managers. Currently, the Fed is the largest individual holder with almost $6tn5, about a quarter of total Treasuries outstanding6. Foreign holders have a combined $7.6tn7, of which central banks hold $3tn8. With the Fed reducing its Treasury holdings by $30-60bn per month, we believe QT’s impact on yields to be initially small, albeit a gradual increase over time.
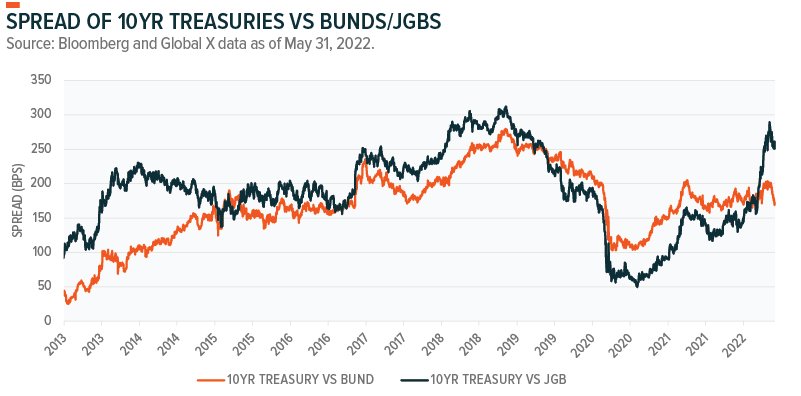
However, we believe that any sustained sell-off in Treasuries would increase their attractiveness relative to global fixed income assets. We would expect asset managers with long horizons to be buyers, such as sovereign wealth funds, pension funds, and insurance companies. Treasuries still offer superior yield to German bonds and Japanese government bonds, and they have less credit and geopolitical risk than alternatives such as global corporates, peripheral European bonds, or Chinese government bonds.
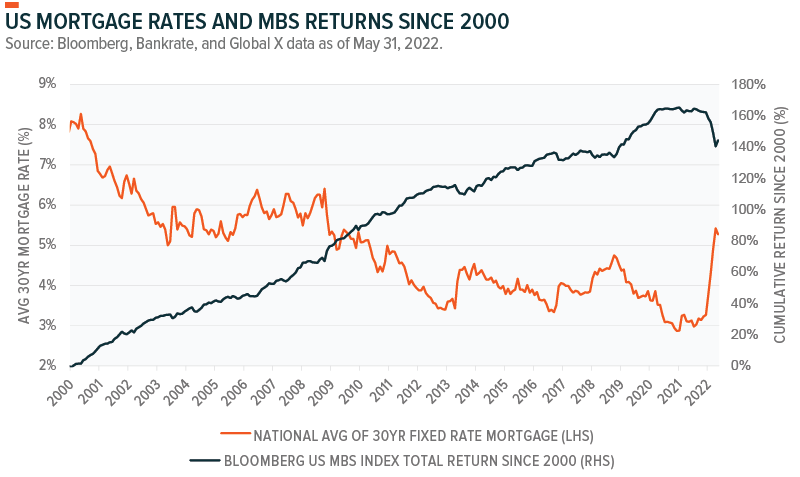
A fixed income segment facing headwinds may be mortgage-backed securities (MBS). The Fed holds almost $3tn of MBS in its portfolio.9 Compared to Treasuries, MBS trade less frequently and have fewer natural buyers. Already this year, we saw the sharpest increase in mortgage rates and drawdown in MBS returns on record. We expect the lack of Fed demand to continue to pressure this market, particularly if the Fed starts to sell MBS in the open market, which the May FOMC minutes suggested may be a possibility.10
If Past is Prologue, Expect the Unexpected with QT
Another effect of QT is a decrease in bank reserves, which combined with higher lending rates restricts access to financing and makes it more expensive to borrow. History shows that these conditions can result in unforeseen consequences.
The Fed attempted to reduce its balance sheet twice previously. The first was in 2013, when the very mention of balance sheet reduction by the Fed led to a market taper tantrum, causing yields to rise sharply.11
The Fed, after learning from past mistakes, was more successful in their second attempt. Guidance better prepared the market to digest the liquidity reduction, and the Fed reduced its balance sheet by about $650bn between October 2017 and September 2019.12 Yet the strain this balance sheet reduction imposed on the financial system along with concurrent rate hikes caused the 2019 repo crisis. On September 17, 2019, repo rates spiked intraday to 10% before the New York Fed intervened.13
In the aftermath, money market traders shared stories about financial institutions scrambling to borrow cash to stay solvent while banks down the street had ample cash but were unable to lend due to balance sheet restrictions. A full dive into the repo crisis is beyond the scope of this paper, but most explanations of why banks were unable to lend include a combination of two factors. First, post-GFC bank regulations required banks to hold higher reserves. Second, the Fed’s balance sheet reduction resulted in lower available reserves, limiting how much that banks could lend out.
Money markets, typically considered one of the more uneventful asset classes among investable securities, almost collapsed the financial system. Thankfully, the repercussions from the repo crisis were not wider. But had the New York Fed taken several hours longer to inject liquidity, the potential for financial institutions to fail was real. This scenario is perhaps the greatest risk of QT: lower liquidity in funding and credit markets increases risk of the financial plumbing “breaking,” to the point where the Fed is forced to abandon tightening.
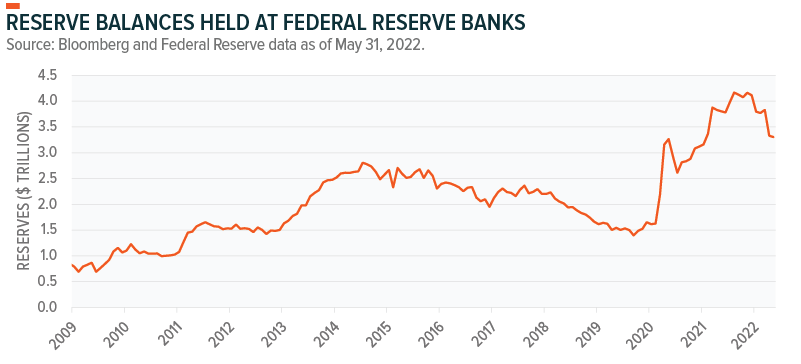
The financial system is unfathomably complex, and no one, the Fed included, can prepare for every possible scenario as it embarks on its most ambitious QT program to date. Currently, banks have ample reserves of $3.3tn (graph below), which leads us to conclude that current risks of a scarcity-induced black swan event are low. As QT drains these reserves, these risks increase; the repo crisis of 2019 occurred almost two years into QT. It’s difficult to predict where vulnerabilities are, though we are cautious of high yield sectors with low (or negative) profit margins, particularly those that require debt refinancing in the coming quarters.
QT Could Exacerbate Already Challenging Conditions for Risk-Adjusted Returns
While markets determine the direction of yields, in the short term, Treasury yields are more likely to be driven by inflation and growth expectations and sentiment. Over time, the lack of Fed demand on Treasury supply may impact liquidity in bond markets. A successful QT program could lead to higher equilibrium yields and steeper curves over the coming years. QT will likely become an increasingly important topic as the Fed removes liquidity from the market.
FOOTNOTES
1 Federal Reserve, Plans for Reducing the Size of the Federal Reserve’s Balance Sheet, May 4, 2022
2 Federal Reserve Bank of St. Louis, How the Fed Is Reducing Its Balance Sheet—and Why, July 10, 2018
3 Transcript of Chair Powell’s Press Conference, May 4, 2022
4 Bloomberg and Global X data as of May 31, 2022
5 Federal Reserve, Federal Reserve Statistical Release – Factors Affecting Reserve Balances, June 2, 2022
6 Treasury Direct, Monthly Statement of the Public Debt of the United States, April 30, 2022
7 U.S. Department of Treasury, Major Foreign Holders of Treasury Securities, Accessed on May 31, 2022
8 Yardeni Research, Inc, Money & Credit: Central Bank Holdings Of US Securities, June 2, 2022
9 Federal Reserve, Federal Reserve Statistical Release – Factors Affecting Reserve Balances, June 2, 2022
10 Federal Open Market Committee, Minutes of the Federal Open Market Committee May 3–4, 2022, Accessed on May 31, 2022
11 FRED, No Taper Tantrum this Time?, August 30, 2021
12 Reuters, What could drive the Fed to a ‘Plan B’ for balance sheet reduction, February 17, 2022
13 Federal Reserve, Fed Notes: What Happened in Money Markets in September 2019?, February 27, 2020
This post first appeared on June 9th, 2022 on the GlobalX
PHOTO CREDIT: https://www.shutterstock.com/g/kapustin/about
DISCLOSURE
Investing involves risk, including the possible loss of principal. Diversification does not ensure a profit nor guarantee against a loss.
This material represents an assessment of the market environment at a specific point in time and is not intended to be a forecast of future events, or a guarantee of future results. This information is not intended to be individual or personalized investment or tax advice and should not be used for trading purposes. Please consult a financial advisor or tax professional for more information regarding your investment and/or tax situation.