

By William Nicolle, Analyst, Sustainable Investment Research, FTSE Russell
Equity markets are experiencing a challenging 2022, with the FTSE All-World’s total return down 12.4% since the beginning of the year.[1] While public commentary is focusing on the outsized role of technology stocks in dragging down indices, a parallel but lesser told story is the recent market performance of the green economy.[2]
As explained in our new paper, while green equities substantially outperformed the market since 2003, the current wave of equity market turbulence is hitting them hard – but it’s unclear if this short-term correction will derail the green economy’s longer-term trend of performance, growth and industry disruption.
Figure 1 shows that ‘green economy’ indices – such as the FTSE Environmental Opportunities All Share (‘EOAS’) and the FTSE Environmental Technologies 100, which track companies who derive over 20% and 50% of their revenues from green products and services – saw stronger growth in 2020 and 2021 than the wider equity market (including the oil and gas sector, which recorded negative returns). However, come 2022 green equities began lagging global equity markets, with total returns from greenest indices falling the fastest, whilst there was a reversal in oil and gas’ negative returns since 2020.
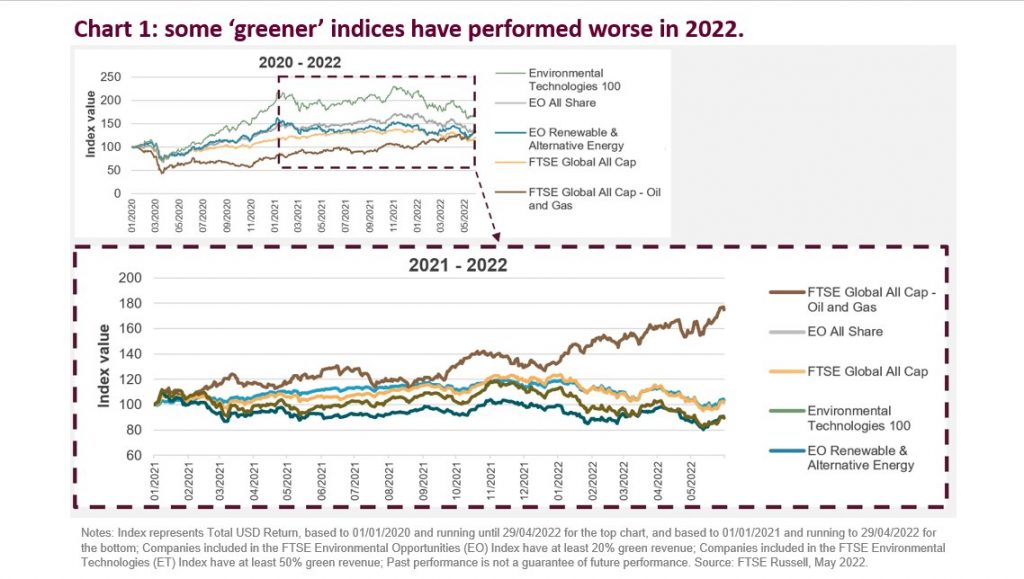
So, why are green equities selling off faster than the market? While it is difficult to say for certain, we attribute it to two main reasons. First, after a long period of strong performance, green equities are recovering from extended valuation premiums. The impact of this market exuberance is acting as a headwind on performance for most growth stocks, but it is already unwinding for green equities, with the green economy’s P/E valuation premium over the broader market narrowing substantially in 2021 from a high at the end of 2020.[3] The result: as the market falls, green equities are falling harder, with the greenest equities tending to fall the hardest.
Second, this is also a story about the mixed performance of underlying green sectors such as renewables and low carbon transport, with some laggards acting as a drag on the whole green economy’s growth. While it is typically assumed that renewables dominate the green economy, since the end of 2020 they generated lower returns than the broader environmental markets, with the sector’s performance falling earlier than the broader green economy – 21.2% behind the EOAS in 2021. Over the same period, other green sectors saw significant growth, such as those related to energy efficiency and water technology, comprising companies like Infineon Technologies, ABB and Xylem Inc.
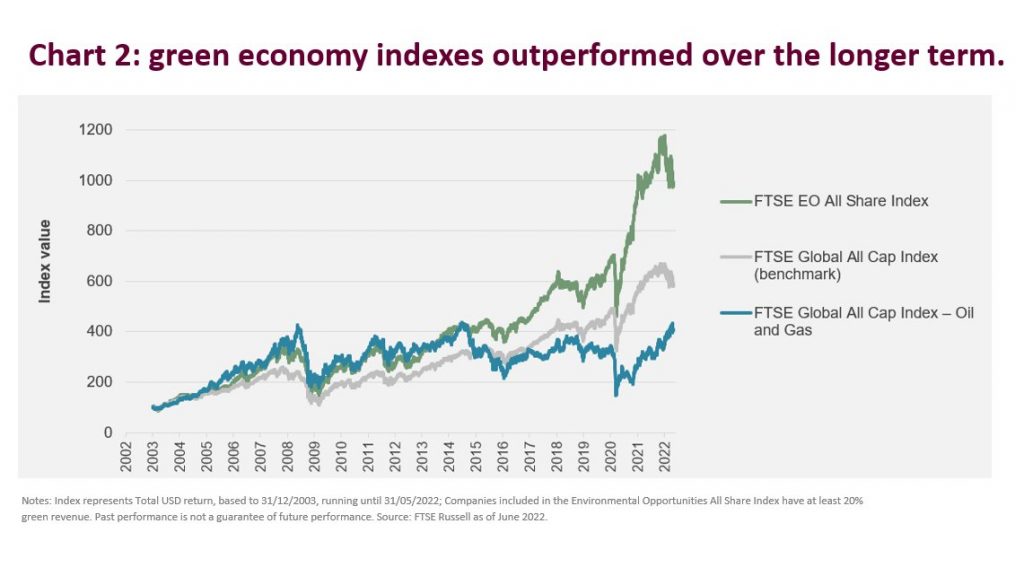
Despite the short term turbulence, adopting a longer-term view tells the story of the green economy’s strong long-run performance (Figure 2). Over the last five years, the FTSE Environmental Opportunities All Share index outperformed the wider equity market by 5.9%, and the oil and gas sector by 19.8%.[4] It also shows that the structural trend of the growing green economy has weathered periods of underperformance in the past – in 2008, 2011 and 2018 – each time bouncing back stronger than it was before.
The long-term drivers of this fast-moving market are still gathering momentum; government focus on climate finance, investors’ interest in sustainable investment, growing solutions to resource and pollution challenges, and the disruption of industries like autos, power generation and materials with new, green technologies. The new geopolitical focus on energy security could also be positive for green companies, with renewable generation and energy efficiency forming a central part of the Europe’s energy independence plans.[5]
While predicting the on-going impact of geo-political risk and the broader market transition on the green economy is difficult, current market turbulence highlights the importance of investors distinguishing between short-term swings in green equities and trends in the broader green economy.
Read the paper in full. For more on ESG equity performance, subscribe to the blog
[1] See FTSE Russell (2022), Factsheet: FTSE All-World Index [data as at 31st May 2022].
[2] Technology stocks are down 21.2% – comparatively larger than the All-World index; See FTSE Russell (2022), Factsheet: FTSE All-World Technology Index [data as at 31st May 2022].
[3] See FTSE Russell (2022), Investing in the Green Economy 2022: Tracking performance and growth in green equities, Figure 22 (‘Market capitalization to net profit ratio’), P24.
[4] Based on the difference between compound annual returns, calculated on a three-year (December 2018 to December 2021) and five-year basis (December 2016 to December 2021); for more details, see FTSE Russell (2022), Investing in the Green Economy 2022: Tracking performance and growth in green equities, P22.
[5] European Commission (2022), REPower EU: affordable, secure and sustainable energy for Europe.
The FTSE Environmental Opportunities All-Share Index comprises all of the companies that have significant involvement in environmental business activities and meet the environmental opportunities eligibility requirements. and the FTSE Environmental Technology 100 Index Series measures the performance of companies globally whose core business is in the development and deployment of environmental technologies as defined by the FTSE Environmental Markets Classification System (EMCS). FTSE All-World index series is a stock market index that covers over 3,100 companies in 47 countries, which started in 1986 as the FT-Actuaries World Index. Investors cannot invest directly in an index.
This post first appeared on June 27th, 2022 on the FTSE Russell blog
PHOTO CREDIT: https://www.shutterstock.com/g/Pcess609
Via SHUTTERSTOCK
© 2022 London Stock Exchange Group plc and its applicable group undertakings (the “LSE Group”). The LSE Group includes (1) FTSE International Limited (“FTSE”), (2) Frank Russell Company (“Russell”), (3) FTSE Global Debt Capital Markets Inc. and FTSE Global Debt Capital Markets Limited (together, “FTSE Canada”), (4) FTSE Fixed Income Europe Limited (“FTSE FI Europe”), (5) FTSE Fixed Income LLC (“FTSE FI”), (6) The Yield Book Inc (“YB”) and (7) Beyond Ratings S.A.S. (“BR”). All rights reserved.
FTSE Russell® is a trading name of FTSE, Russell, FTSE Canada, FTSE FI, FTSE FI Europe, YB and BR. “FTSE®”, “Russell®”, “FTSE Russell®”, “FTSE4Good®”, “ICB®”, “The Yield Book®”, “Beyond Ratings®” and all other trademarks and service marks used herein (whether registered or unregistered) are trademarks and/or service marks owned or licensed by the applicable member of the LSE Group or their respective licensors and are owned, or used under license, by FTSE, Russell, FTSE Canada, FTSE FI, FTSE FI Europe, YB or BR. FTSE International Limited is authorized and regulated by the Financial Conduct Authority as a benchmark administrator.
All information is provided for information purposes only. All information and data contained in this publication is obtained by the LSE Group, from sources believed by it to be accurate and reliable. Because of the possibility of human and mechanical error as well as other factors, however, such information and data is provided “as is” without warranty of any kind. No member of the LSE Group nor their respective directors, officers, employees, partners or licensors make any claim, prediction, warranty or representation whatsoever, expressly or impliedly, either as to the accuracy, timeliness, completeness, merchantability of any information or of results to be obtained from the use of FTSE Russell products, including but not limited to indexes, data and analytics, or the fitness or suitability of the FTSE Russell products for any particular purpose to which they might be put. Any representation of historical data accessible through FTSE Russell products is provided for information purposes only and is not a reliable indicator of future performance.
No responsibility or liability can be accepted by any member of the LSE Group nor their respective directors, officers, employees, partners or licensors for (a) any loss or damage in whole or in part caused by, resulting from, or relating to any error (negligent or otherwise) or other circumstance involved in procuring, collecting, compiling, interpreting, analyzing, editing, transcribing, transmitting, communicating or delivering any such information or data or from use of this document or links to this document or (b) any direct, indirect, special, consequential or incidental damages whatsoever, even if any member of the LSE Group is advised in advance of the possibility of such damages, resulting from the use of, or inability to use, such information.
No member of the LSE Group nor their respective directors, officers, employees, partners or licensors provide investment advice and nothing in this document should be taken as constituting financial or investment advice. No member of the LSE Group nor their respective directors, officers, employees, partners or licensors make any representation regarding the advisability of investing in any asset or whether such investment creates any legal or compliance risks for the investor. A decision to invest in any such asset should not be made in reliance on any information herein. Indexes cannot be invested in directly. Inclusion of an asset in an index is not a recommendation to buy, sell or hold that asset nor confirmation that any particular investor may lawfully buy, sell or hold the asset or an index containing the asset. The general information contained in this publication should not be acted upon without obtaining specific legal, tax, and investment advice from a licensed professional.
Past performance is no guarantee of future results. Charts and graphs are provided for illustrative purposes only. Index returns shown may not represent the results of the actual trading of investable assets. Certain returns shown may reflect back-tested performance. All performance presented prior to the index inception date is back-tested performance. Back-tested performance is not actual performance, but is hypothetical. The back-test calculations are based on the same methodology that was in effect when the index was officially launched. However, back-tested data may reflect the application of the index methodology with the benefit of hindsight, and the historic calculations of an index may change from month to month based on revisions to the underlying economic data used in the calculation of the index.
This document may contain forward-looking assessments. These are based upon a number of assumptions concerning future conditions that ultimately may prove to be inaccurate. Such forward-looking assessments are subject to risks and uncertainties and may be affected by various factors that may cause actual results to differ materially. No member of the LSE Group nor their licensors assume any duty to and do not undertake to update forward-looking assessments.
No part of this information may be reproduced, stored in a retrieval system or transmitted in any form or by any means, electronic, mechanical, photocopying, recording or otherwise, without prior written permission of the applicable member of the LSE Group. Use and distribution of the LSE Group data requires a license from FTSE, Russell, FTSE Canada, FTSE FI, FTSE FI Europe, YB, BR and/or their respective licensors.
