By Matthew J Bartolini, CFA, Head of SPDR Americas Research
The most followed yield curve term spread is the difference between the US 10-year yield and the US 2-year yield. The yield curve is said to be inverted when the 2-year rate yields more than the longer 10-year rate.
Research shows that an inverted yield curve has predated the last nine recessions, with one false positive.1 It’s usually talked about as a reliable indicator that a recession may be on the horizon.
While the fact that an inversion has preceded every recession over the past 70 years is noteworthy, there is more to the story. And the current market has a “this time is different” feel.
The slope of the yield curve reflects information about current and expected future monetary policy actions (the short end) as well as the market’s attitude towards risks, growth, and inflation (the long end). Both are linked to the expectations of future business cycle outcomes.
Right now, as the Federal Reserve (Fed) seeks to reign in elevated inflation levels, it is expected to continue to hike rates for the rest of the year. The market is expecting at least eight more increases in 2022.2 This would put the Federal Funds Rate at an implied level of 2.4%.3
This has pushed short-term rates up 160 percentage points over the last three months to 2.34%.4 Long-term rates, however, have also risen (a bear flattener) by 88 percentage points to 2.39%,5 as growth and inflation continue to remain above trend and investors are seeking a premium for lending their money that far out in the future.
Yet, these two moves have compressed the spread. In a recent client meeting I was asked, “What is the yield curve telling you?” I responded that both rates are nearly the same — and I was serious. Right now, the yield curve is not telling me much about a looming recession, the question the client was really asking.
There are two factors at play:
- The historical precedent has a large error term.
- Real rates are currently negative and quantitative easing (QE) has suppressed the long end.
The Yield Curve’s Historical Precedent
Much has been written about the relationship between interest rates and the economy. Rudebusch and Williams (2009) showed that an inverted yield curve reliably predicts low future output growth and indicates a high probability of recession. Estrella and Mishkin (1997) found that this relationship holds both in the United States and for multiple other advanced economies.
As a result, the term spread metric is closely watched by professional forecasters and policymakers. The numbers also back it up. The chart below shows that, using a spliced version of the US 1-year and US 2-year yield (given the latter didn’t start trading until the 1970’s) from January 1955 to now, an inverted yield curve has predated all nine recessions.
With just one false positive in 1965, that’s a 90% hit rate overall. In 1965, the economy did enter a slowdown — not a recession — consistent with a portion of the economic theory above about the yield curve portending slower growth.
Monthly View of Yield Curve and Recessions
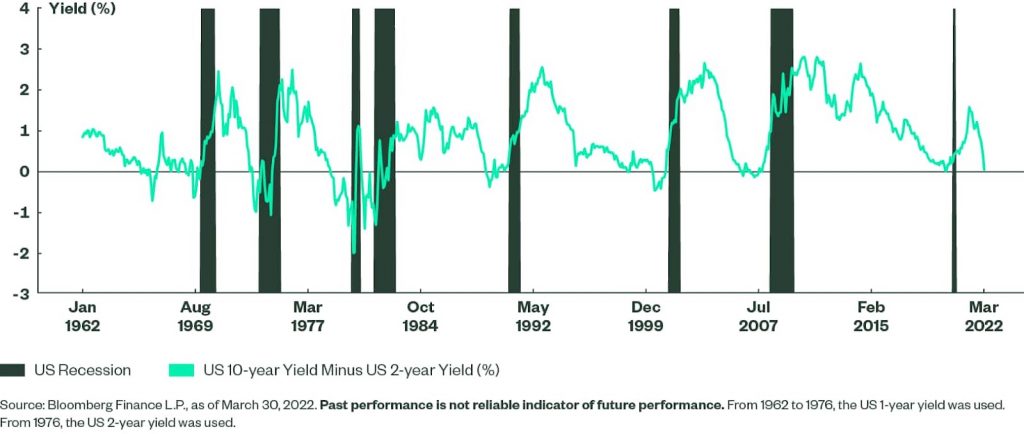
But the delay between the term spread turning negative and the beginning of a recession has ranged anywhere from six to 24 months. That’s quite a gap! That means the yield curve could invert and, at a minimum, an entire baseball season could be played before a recession even began. At the long end, it could be two years before a recession hits. So while the yield curve inversion’s hit rate is high, its timing leaves a lot to be desired.
With so many other variables impacting the pace of the economy over a six- or 24-month duration, it’s hard to conclude that an inverted yield curve indicates a recession is imminent. While the yield curve inverted in 2019 and a recession followed in 2020, the reason for the recession was a global pandemic. That’s not something the yield curve could have forecasted.
Duration of Yield Curve Inversion Matters
Similarly, the duration of the inversion should be considered. The above chart shows the yield curve on a monthly basis. When run with a daily screen, there are more inversions that don’t lead to a recession. The daily version below shows a two-day inversion in 1998, 30 months before the 2001 recession. And, when viewed on a daily basis, the 2006 inversion actually began in 2005 — still predating the recession in 2007/2008, but with a longer latency.
Daily View of Yield Curve and Recessions
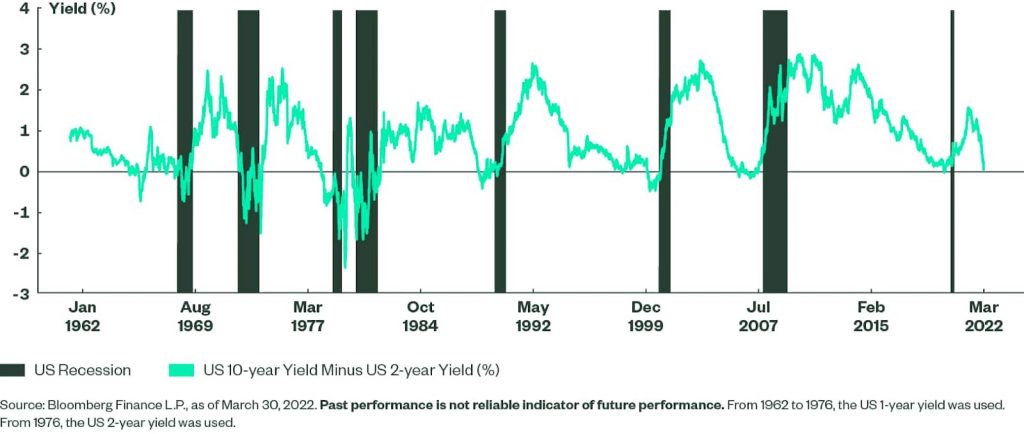
Those details matter, particularly as we evaluate this recent brief inversion.
The takeaway for investors?
- There are more variables to consider than simply a curve inversion to determine if a recession is imminent.
- Idiosyncratic events that the yield curve could not have reflected beforehand can be a bigger driver of a recession (e.g., 1987 stock market crash, 9/11, a pandemic)
- The duration of the inversion is more important, as false-positive inversions can occur for brief periods based on a plethora of macro forces.
Impact of Real Rates and Quantitative Easing
An inverted yield curve coinciding with a recession has never occurred when real rates, as measured by the yield on the constant maturity US 10-Year Treasury Inflation Protected Security (TIPS), were negative.
Rates did dip into negative territory in 2019 prior to the 2020 recession, but we know the 2020 recession was brought on by the pandemic. And it was also the shortest recession on record.
Why do real rates matter in this case? When they are negative, it fosters increased risk-taking on high-growth investments, as the opportunity cost of holding cash — or “doing nothing” — is less than zero. This should be supportive to economic and fundamental growth, mitigating the likelihood of a near-term recession. And this would seem to be supported by consensus economist forecasts for US GDP growth to be 3.5% and 2.3% in 2022 and 2023, respectively, with each of the next eight quarters all positive and above 2%.6
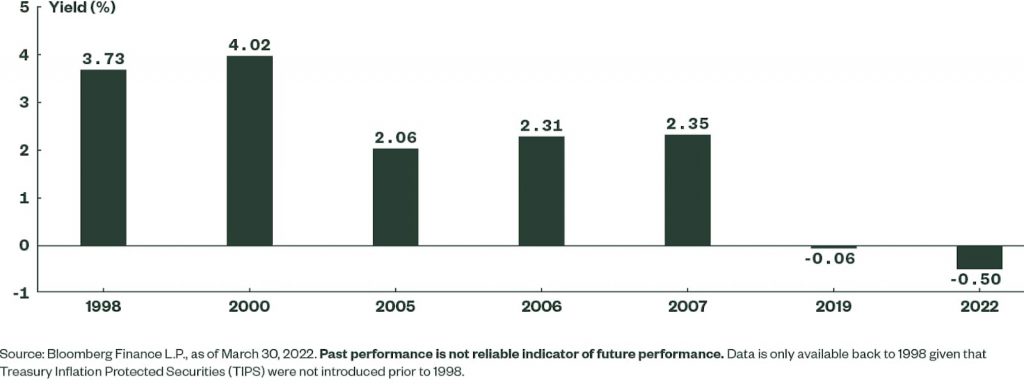
In fact, real rates have historically averaged 2.40%7 over the three months prior to a yield curve inversion, based on daily data. Right now, they are -0.50%. And this is a conservative measure of real yields, as a more extreme measure of the current nominal US Treasury yield minus the rate of current CPI is -6%.
Average Real Yield During Inversions (US 10-Year TIPS Yield)
Also, the long end is somewhat artificially suppressed by the fact that the Fed has expanded its balance sheet significantly since the pandemic, and has been a major buyer of Treasuries further out on the long end of the curve. Prior to the pandemic, US Treasury notes and bonds made up 52% of the central bank balance sheet. Now it is close to 60%, following nearly $3 trillion worth of purchases.8
As a result, the 10-year yield is likely lower (i.e., suppressed) than it should be if the Fed had not undertaken QE. If we start to have quantitative tightening — where the central bank begins to wind down the balance sheet — it could put upward pressure on long-term rates and potentially steepen the curve. Another reason why this week’s very brief inversion should be discounted as a persistent trend.
Pause the Inversion Recession Talk for Now
After just one day, the yield curve inversion of 2022 has already reversed course, an indication of how the duration of an inversion may be more important than the mere presence of one.
Historical precedent aside, the yield curve inverting is more noise than news given the supportive growth environment and the large amount of variance associated with curve predictions. Not to mention it only covers nine periods, a fairly small sample size.
For now, let’s pause talk of the inversion equating to recession. Instead, focus on the monetary policies flattening the yield curve and the associated impacts on portfolios by trimming duration with floating rate securities.
For more information and market updates, visit the SPDR Blog.
This post first appeared on April 1, 2022 on the State Street Global Advisors Blog.
PHOTO CREDIT: https://www.shutterstock.com/g/g0d4ather
Via SHUTTERSTOCK
DISCLOSURE
Investing involves risk, including the possible loss of principal. Diversification does not ensure a profit nor guarantee against a loss.
This material represents an assessment of the market environment at a specific point in time and is not intended to be a forecast of future events, or a guarantee of future results. This information is not intended to be individual or personalized investment or tax advice and should not be used for trading purposes. Please consult a financial advisor or tax professional for more information regarding your investment and/or tax situation.