By Mark Barnes, PhD, head of investment research (Americas), and Christine Haggerty, research & analytics
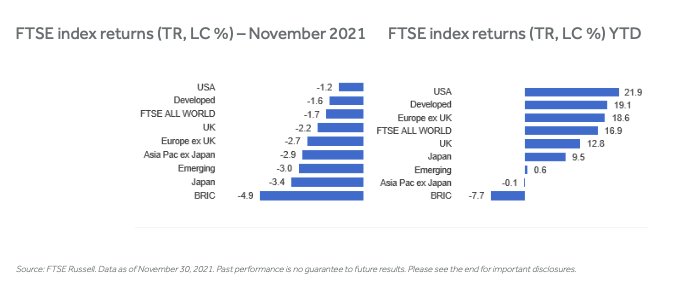
The discovery of a new Covid-19 variant in late-November ratcheted up already high anxieties about renewed lockdowns across Europe, worsening inflation and central-bank tightening, triggering a panic sell off that left few of the world’s equity markets and stock sectors unscathed.
Along with only a handful of other stock markets, the US held up reasonably well amid the global rout, outperforming the FTSE All-World Index for November and barely denting its significant lead for the year so far. The FTSE Japan, FTSE Asia Pacific and FTSE Emerging indexes suffered the steepest losses.
US Stocks
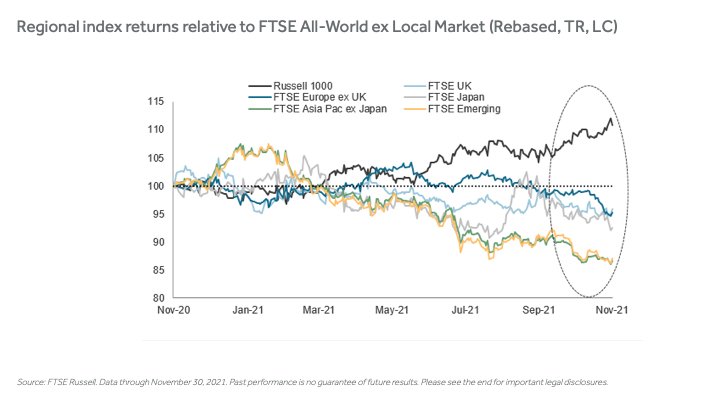
The relative resilience of US stocks, particularly among large-caps, further expanded the Russell 1000’s already outsized 11-point performance edge over non-US peers for the past 12 months, which roughly covers the entire span since the news of the Covid-19 vaccine breakthrough was first announced a year ago.
Over this same period, relative returns elsewhere have sunk deeper into negative territory. This underperformance has been particularly severe for Asia Pacific and emerging markets, which each trail their global peers by 13-percentage points for the 12 months.
The Russell 1000’s outperformance versus its global peers in November is largely an upshot of its huge exposure to technology stocks, which rose 2.4% globally as nervous investors sought shelter in companies offering reliable growth fundamentals.
The rally in long-dated US Treasuries also helped growth stocks, as falling yields enhanced their future discounted cash flows. (Technology makes up 32% of the Russell 1000, versus 14% for the non-US index.)
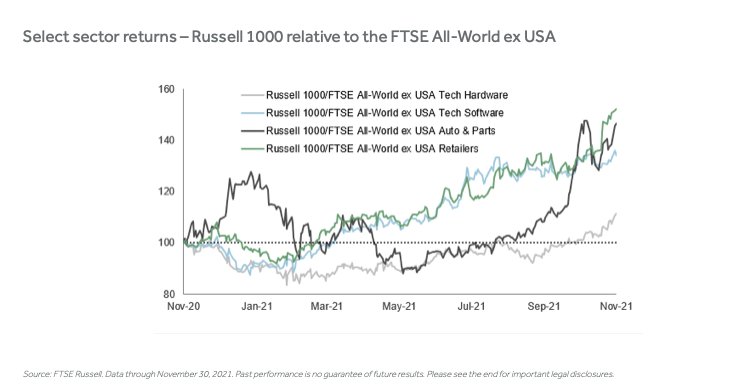
The Russell 1000 also benefited from it being overweight in consumer discretionary stocks, particularly those of retailers and auto & auto parts, a carryover from October.
As the chart below illustrates, the outperformance of large-cap technology and discretionary sectors has been a steadfast driver of Russell 1000 leadership this year, with Big Auto and retail stocks lending a helping hand to tech hardware and software stocks over the past several months.
This post first appeared on December 6 on the FTSE Russell blog.
Photo Credit: Yuri Samoilov via Flickr Creative Commons
DISCLOSURE
All information is provided for information purposes only. All information and data contained in this publication is obtained by the LSE Group, from sources believed by it to be accurate and reliable. Because of the possibility of human and mechanical error as well as other factors, however, such information and data is provided “as is” without warranty of any kind.
The Russell 1000 Index is a stock market index that tracks the highest-ranking 1,000 stocks in the Russell 3000 Index, which represent about 90% of the total market capitalization of that index.
The FTSE All-World Index is a market-capitalisation weighted index representing the performance of the large and mid cap stocks from the FTSE Global Equity Index Series and covers 90-95% of the investable market capitalisation. It has regional components that cover Europe, Asia, Emerging Markets, the UK and Japan. Investors can’t invest directly in indexes. |
No responsibility or liability can be accepted by any member of the LSE Group nor their respective directors, officers, employees, partners or licensors for (a) any loss or damage in whole or in part caused by, resulting from, or relating to any error (negligent or otherwise) or other circumstance involved in procuring, collecting, compiling, interpreting, analyzing, editing, transcribing, transmitting, communicating or delivering any such information or data or from use of this document or links to this document or (b) any direct, indirect, special, consequential or incidental damages whatsoever, even if any member of the LSE Group is advised in advance of the possibility of such damages, resulting from the use of, or inability to use, such information.
No member of the LSE Group nor their respective directors, officers, employees, partners or licensors provide investment advice and nothing contained in this document or accessible through FTSE Russell Indexes, including statistical data and industry reports, should be taken as constituting financial or investment advice or a financial promotion.
Past performance is no guarantee of future results. Charts and graphs are provided for illustrative purposes only. Index returns shown may not represent the results of the actual trading of investable assets. Certain returns shown may reflect back-tested performance. All performance presented prior to the index inception date is back-tested performance. Back-tested performance is not actual performance, but is hypothetical. The back-test calculations are based on the same methodology that was in effect when the index was officially launched. However, back- tested data may reflect the application of the index methodology with the benefit of hindsight, and the historic calculations of an index may change from month to month based on revisions to the underlying economic data used in the calculation of the index.
This publication may contain forward-looking assessments. These are based upon a number of assumptions concerning future conditions that ultimately may prove to be inaccurate. Such forward-looking assessments are subject to risks and uncertainties and may be affected by various factors that may cause actual results to differ materially. No member of the LSE Group nor their licensors assume any duty to and do not undertake to update forward-looking assessments.