

By Mark Barnes, head of investment research (Americas), and Christine Haggerty, global investment research
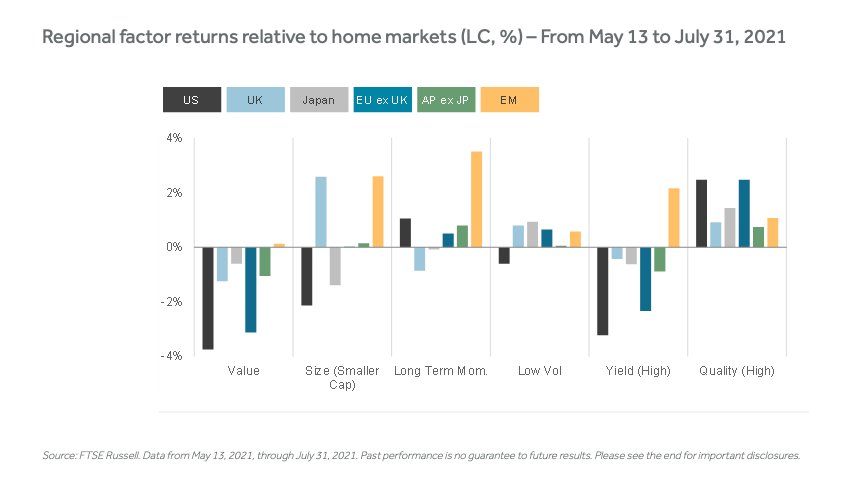
Since mid-May, the global rallies in Value and Size factors have cooled, and Quality has staged a robust comeback. The catalyst: growing concerns that the rapid spread of the more virulent Delta variant and persistent supply-chain disruptions may delay or derail the global economic recovery.
The about-face has been particularly stark in the US, where Value has trailed the broad market by nearly four percentage points since its May 13 peak, while Quality has outperformed by 2.5 percentage points. The trend-following Momentum factor has also revived. Europe saw a similarly pronounced reversal in factor behavior.
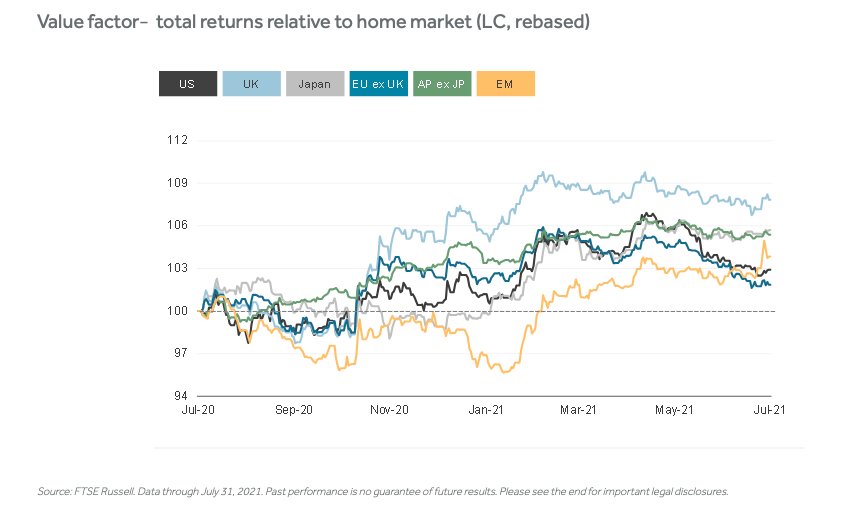
The two time-series charts below depict the dramatic ebb and flow of Value and Quality performances since the initial surge in market euphoria last November, sparked by vaccine breakthroughs and ongoing aggressive crisis-fighting monetary and fiscal stimulus efforts. Recent moves reflect shifts to more nuanced expectations for economic growth, inflation and earnings in the year ahead.
The burst in reopening optimism last fall spurred a sharp rotation from Quality into Value, which is more heavily weighted to cyclically sensitive industries poised to profit from a reflating economy. The spike in long government bond yields earlier this year was also conducive to Value outperformance, by making the value of future earnings of the pricier, growth-heavy Quality factor less attractive.
Despite recent setbacks, Value remains a strong outperformer across markets for the 12 months, particularly in the UK, Japan and Asia Pacific.
Value factor ̶ total returns relative to home market (LC, rebased)
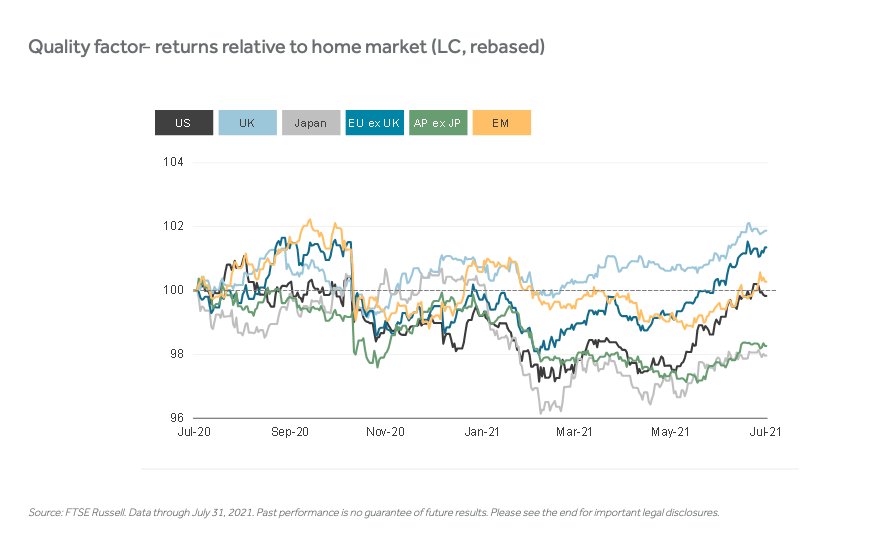
The Quality rebound has come amid signs that the best of the economic and corporate-earnings recoveries may be behind us, as well as the discernibly more cautious tone in market sentiment. This has favored the stocks of strong, relatively reliable earnings growers (notably in technology and health care) that dominate the factor’s industry exposures. The sharp pullback in long bond yields since mid-March has also been a tailwind.
This comeback gathered steam in June and July, restoring Quality to outperformance status for the 12 months in the UK, Europe, emerging markets and nearly so in the US − though it still lagged in developed Asian markets.
This post first appeared on August 5 on the FTSE Russell blog.
Photo Credit: Steve Higgins via Flickr Creative Commons
DISCLOSURE
All information is provided for information purposes only. All information and data contained in this publication is obtained by the LSE Group, from sources believed by it to be accurate and reliable. Because of the possibility of human and mechanical error as well as other factors, however, such information and data is provided “as is” without warranty of any kind. No member of the LSE Group nor their respective directors, officers, employees, partners or licensors make any claim, prediction, warranty or representation whatsoever, expressly or impliedly, either as to the accuracy, timeliness, completeness, merchantability of any information or of results to be obtained from the use of FTSE Russell products, including but not limited to indexes, data and analytics, or the fitness or suitability of the FTSE Russell products for any particular purpose to which they might be put. Any representation of historical data accessible through FTSE Russell products is provided for information purposes only and is not a reliable indicator of future performance.
No responsibility or liability can be accepted by any member of the LSE Group nor their respective directors, officers, employees, partners or licensors for (a) any loss or damage in whole or in part caused by, resulting from, or relating to any error (negligent or otherwise) or other circumstance involved in procuring, collecting, compiling, interpreting, analysing, editing, transcribing, transmitting, communicating or delivering any such information or data or from use of this document or links to this document or (b) any direct, indirect, special, consequential or incidental damages whatsoever, even if any member of the LSE Group is advised in advance of the possibility of such damages, resulting from the use of, or inability to use, such information.
No member of the LSE Group nor their respective directors, officers, employees, partners or licensors provide investment advice and nothing contained in this document or accessible through FTSE Russell Indexes, including statistical data and industry reports, should be taken as constituting financial or investment advice or a financial promotion.
Past performance is no guarantee of future results. Charts and graphs are provided for illustrative purposes only. Index returns shown may not represent the results of the actual trading of investable assets. Certain returns shown may reflect back-tested performance. All performance presented prior to the index inception date is back-tested performance. Back-tested performance is not actual performance, but is hypothetical. The back-test calculations are based on the same methodology that was in effect when the index was officially launched. However, back- tested data may reflect the application of the index methodology with the benefit of hindsight, and the historic calculations of an index may change from month to month based on revisions to the underlying economic data used in the calculation of the index.


