The second quarter ended on June 30. For most investors it has been a solid one. This week seems like an opportune time to revisit the performance of key financial indicators over the past month and quarter. One of the best ways to do that is to take a look at the normalized performances of key indices. We will do that in some graphs below.
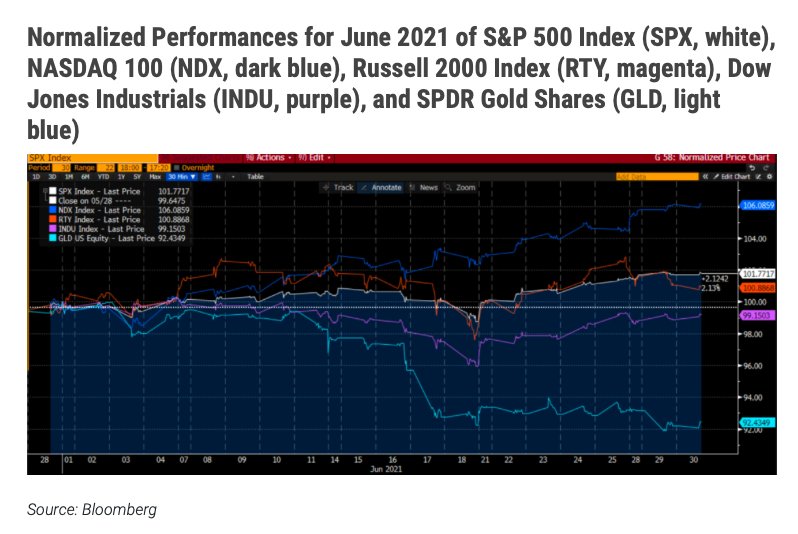
We can see that NDX was the clear winner. Investors have been rotating back into the NASDAQ mega-caps for the past month, which has driven significant outperformance to those who were early in that move. The performance of those stocks has helped SPX to a modest gain, and consequently left RTY and INDU as underperformers. Also, despite the incessant inflation talk, gold has sagged significantly.
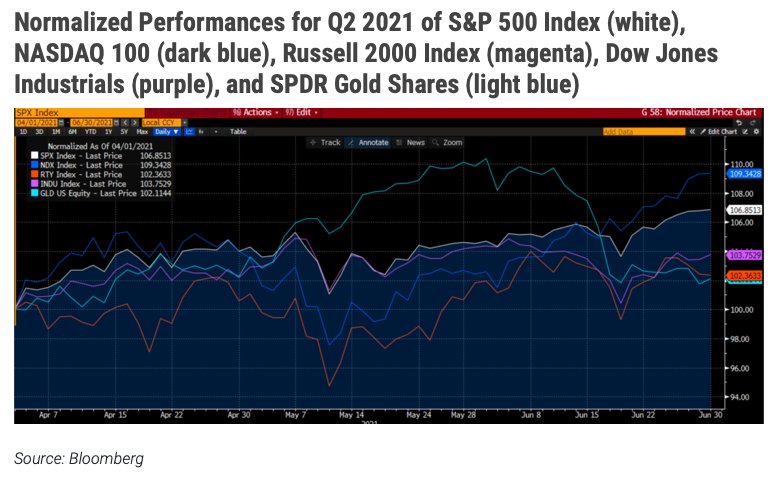
When we look at the same graph for the full second quarter, we see that everything was a winner. The leadership remains with NDX and SPX, but TRY and GLD also show as winners for the quarter. The takeaway here is that the continuation of monetary and fiscal stimulus were clearly beneficial to a wide range of asset classes.
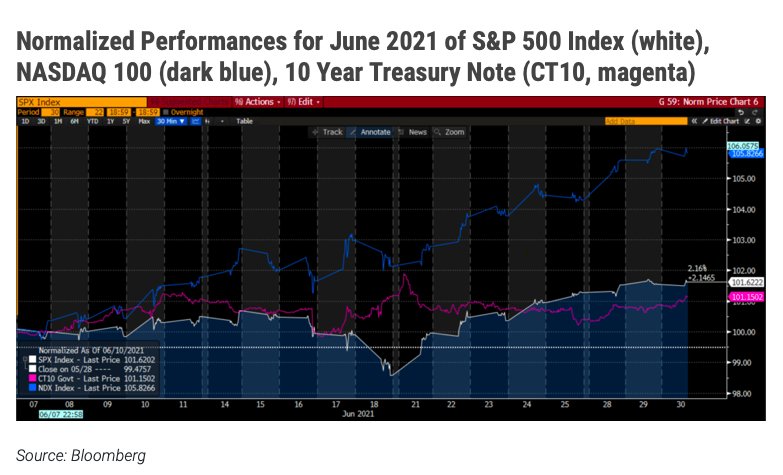
Much of the gain in NDX was attributed to the reduction in bond yields that we saw this quarter. Bear in mind that 10-year Treasury note yields peaked at the end of last quarter, as bond investors seemed to race to the exits ahead of growing inflation fears.
At the time, NDX mega-caps suffered because of valuation fears. Remember that most stock valuation methods utilize the present value of future earnings and/or cash flows. The higher the interest rate, the lower the present value (and vice versa).
Some might question whether investors were truly concerned about equity valuations that were already sky-high by historical measures, but the rebound in bond prices (lower yields) gave investors a rationale to place even higher valuations on those market leaders
Source: Bloomberg
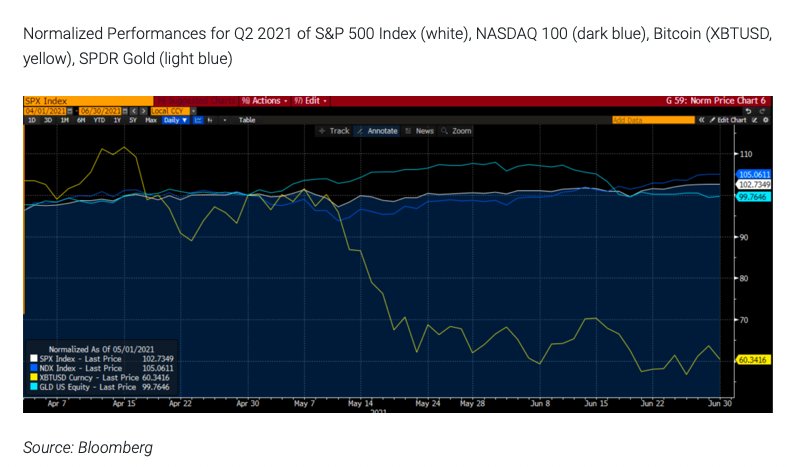
Finally I would be remiss if I failed to point out the moves in the largest cryptocurrency, bitcoin. The performance this quarter is truly staggering. After a pop to fresh highs in April, bitcoin sank steadily and has lost over 1/3 of its value this quarter:
Source: Bloomberg
To be fair, bitcoin is still higher year-to-date, but my fear is that many individual investors participated during the run-up in the first quarter and are feeling some pain during the second.
Takeaway
If there is a lesson to be learned from the second quarter, it is that investors benefited once again from the effects of the last fiscal stimulus package and ongoing monetary stimulus.
If the Federal Reserve stays on course with its bond purchases and monetary expansion, and the proposed infrastructure deal makes progress to becoming law, then investors are likely to continue with strategies that have worked well for months.
If there are stumbles in Congress, or if the Fed’s migration from thinking about talking about tapering to talking about tapering to actually putting out feelers about tapering (or more), then a change in plans might be in order.
The third quarter brings us the Fed’s Jackson Hole conference in late August, where changes in monetary outlook are often signaled, and yet another impending fight over the federal debt ceiling which could occur anytime in the next couple of months.
Things generally went well this quarter, but that doesn’t mean that investors should assume that it will continue unabated for the coming quarter.
This article first appeared on June 30 on the Traders’ Insight blog.
Photo Credit: Tom Britt via Flickr Creative Commons
DISCLOSURE: INTERACTIVE BROKERS
The analysis in this material is provided for information only and is not and should not be construed as an offer to sell or the solicitation of an offer to buy any security. To the extent that this material discusses general market activity, industry or sector trends or other broad-based economic or political conditions, it should not be construed as research or investment advice. To the extent that it includes references to specific securities, commodities, currencies, or other instruments, those references do not constitute a recommendation by IBKR to buy, sell or hold such investments. This material does not and is not intended to take into account the particular financial conditions, investment objectives or requirements of individual customers. Before acting on this material, you should consider whether it is suitable for your particular circumstances and, as necessary, seek professional advice.
DISCLOSURE: FOREX
There is a substantial risk of loss in foreign exchange trading. The settlement date of foreign exchange trades can vary due to time zone differences and bank holidays. When trading across foreign exchange markets, this may necessitate borrowing funds to settle foreign exchange trades. The interest rate on borrowed funds must be considered when computing the cost of trades across multiple markets.
DISCLOSURE: BITCOIN FUTURES
Trading in Bitcoin futures is especially risky and is only for clients with a high risk tolerance and the financial ability to sustain losses. More information about the risk of trading bitcoin products can be found on the IBKR website.If you’re new to bitcoin, or futures in general please visit CME Bitcoin Futures.
PLEASE NOTE AT THIS TIME INTERACTIVE BROKERS PROVIDES LIMITED ACCESS TO CRYPTO-RELATED PRODUCTS. ELIGIBILITY TO TRADE IN CRYPTO-RELATED PRODUCTS MAY VARY BASED ON JURISDICTION. TRADING IN CRYPTO-RELATED PRODUCTS IS ESPECIALLY RISKY AND IS ONLY FOR CLIENTS WITH A HIGH RISK TOLERANCE AND THE FINANCIAL ABILITY TO SUSTAIN LOSSES.
The Standard and Poor’s 500, or simply the S&P 500, is a stock market index tracking the stock performance of 500 of the largest companies listed on stock exchanges in the United States.The Nasdaq Composite is a stock market index that includes almost all stocks listed on the Nasdaq stock exchange.
The Dow Jones Industrial Average, Dow Jones, or simply the Dow, is a price-weighted measurement stock market index of the 30 prominent companies listed on stock exchanges in the United States.The Russell 2000 Index is a small-cap stock market index of the smallest 2,000 stocks in the Russell 3000 Index. Investors can’t invest directly in indexes.