

By Rohan Reddy, Research Analyst, Global X ETFs
The Global X Income Outlook for Q2 2021 can be viewed here. This report seeks to provide macro-level data and insights across several income-oriented asset classes and strategies.
Key Takeaways:
- Inflation accelerated in Q2, amid re-opening exuberance and disrupted supply chains
- The Federal Reserve’s May meeting acknowledged inflationary pressures and potentially more hawkish policy in 2022-2023
- Long term bond yields have plummeted and Growth has resumed its leadership over Value, signaling that the market is less concerned about persistent, structural inflation
- In a low yield environment with potentially rising rates in the next 1-2 years, we favor real assets like MLPs and REITs that offer high yields and the potential to pass through inflationary pressures to their customers
- Covered call strategies may also help generate income in volatile markets as inflation data is noisy
Inflation Accelerated in Q2
Last quarter we discussed the looming reflation in Q2, and that thesis certainly came to fruition based on headline numbers. Year over year (YoY) the Consumer Price Index (CPI) rose 4.2% in April, 5.0% in May, and 5.4% in June.1 The numbers may seem staggering for the United States economy at first glance, but it’s important to consider the context. A year ago, Q2 2020, represented the depths of the pandemic in the U.S. and most of the western world. Swift reopening progress in Q1-Q2 2021, due to effective vaccine distribution, has helped accelerate the economic recovery, causing abrupt pressure on supply chains and unusual comparisons with year-old data points.
Closer examination of the inflation data for Q2 shows that inflationary may be concentrated within certain segments. In June, used car prices were up 45.2% and energy prices increased 24.5% YoY.2 Used cars are a 3.2% weight in the CPI basket, and energy is a 7.1% weight.3
More critical to the inflation equation, however, is whether strong consumption persists and if supply chains can operate more consistently and efficiently. On the consumption side, the latest retail sales numbers from June showed only an 0.6% increase for the month. Fading re-opening enthusiasm or the drying up of government stimulus checks could be factors in the sluggish growth numbers compared to prior month. In addition, a broader consumer shift from goods to services may be partly to blame as well. Furniture sales fell -3.6% in June for example, but bar and restaurant sales increased 2.3% for the month. The latest PCE Services Index numbers from May finished up 0.7% compared to a -1.3% decline in the PCE Goods Index.4 Services inflation is fueled by re-opening enthusiasm, while goods inflation may stem primarily from supply chain challenges.
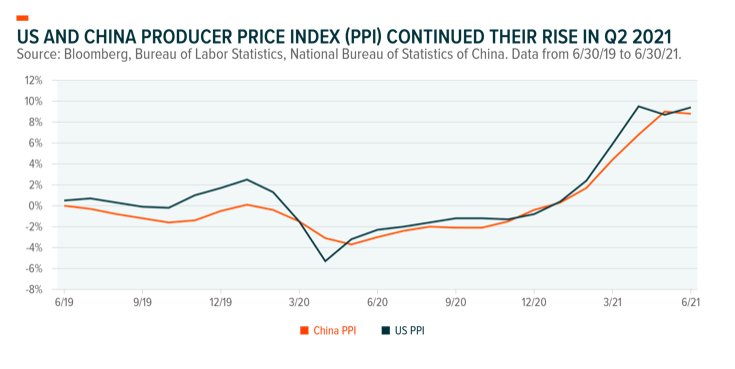
Supply side pressures are unlikely to abate for the rest of the year based on continued labor shortages, just-in-case purchasing of goods, and concerns around the spread of the delta variant. Both in the US and China, the world’s two largest economies, producer prices sharply increased in Q2 due to these challenges. Beijing was even so concerned about rising prices in the metals market that the government released some of its strategic reserves to increase supply and pressured manufacturers to avoid unnecessary purchases.
Markets Signaling Transitory Inflation
The Fed continues to insist that inflation is transitory, but during the quarter expressed greater concern for slowing its impact. While initially the Fed looked to raise rates for the first time in 2024, a raft of data showing higher inflationary pressures caused the central bank to upgrade its inflation forecast for 2021 from 2.4% to 3.4%, alongside upping 2021 GDP growth expectations from 6.5% to 7.0%. More importantly, the Fed dot plot signaled two possible rate hikes in 2023, and potentially even a rate hike as early as 2022. Yet by next year the Fed sees inflation returning to 2.1%, in-line with their long-term target.
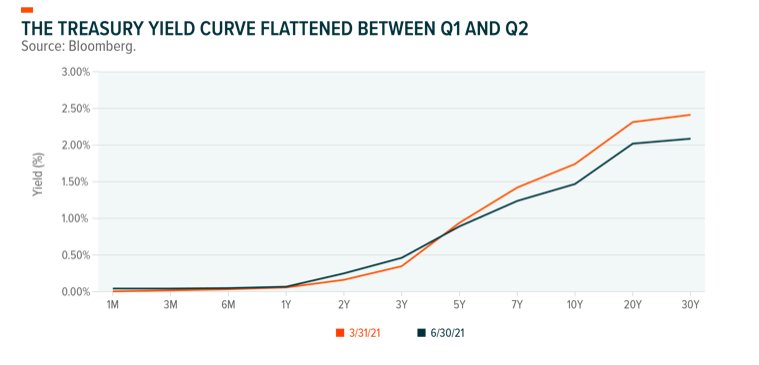
Bond and equity markets indicated growing confidence that inflation is transitory as well. The yield curve flattened as yields on short term treasuries rose and long term yields fell. This signals the market’s expectation for rising policy rates in the near term and inflation subsiding in the long term. Other asset classes responded in a similar manner, with reflation trades like small caps, commodities like copper, and emerging market equities lagging long duration growth sectors like Technology.
Real Assets and Select Reopening Plays Have Outperformed
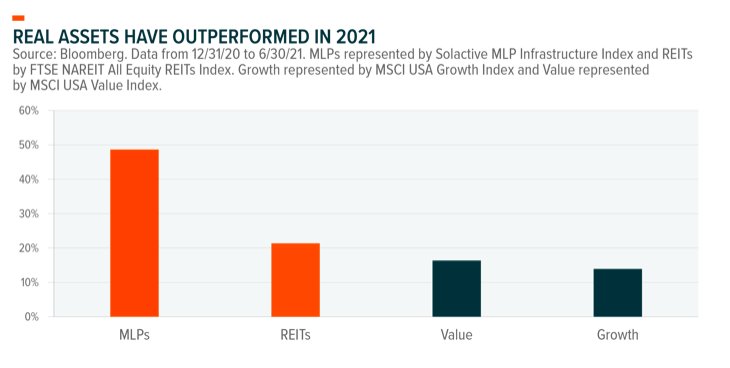
The tug of war between whether inflation is short lived or if it will be with us for a while is playing out in the equity markets as well. Value stocks rallied in Q1 when inflation concerns were greater, outperforming Growth by 9.82%.5 But as the Fed became more hawkish in Q2, the long term bonds rallied and Growth outperformed Value by 7.16%. Should inflation remain higher for longer, real assets and small caps could continue their strong recent performance.
Real assets like MLPs and REITs exhibit Value characteristics and have been in favor with investors given their high yields and ability to pass through inflation to customers. MLPs offer 7.63% yields and REITs stand at 2.85%.6 In the MLP space, many contracts with customers are structured to adjust with rises in CPI, while in the REIT space, inflation can often be passed through as higher rents. With the 10-year treasury yield below 1.5%, these asset classes can help enhance portfolio yield and mitigate some of the impacts of continued inflation, unlike traditional fixed income.
Despite strong performance year to date, valuations on these two asset classes remain reasonable. Relative to year-end 2019 forward EV/EBITDA (Enterprise value/ Earnings before Interest, Taxes, Depreciation, and Amortization) valuations before the pandemic, MLPs are trading at a -9.3% discount and REITs at a 10.3% premium. The S&P 500, however, is at a 13.1% premium.7
Also likely benefiting from a potentially higher-for-longer inflation scenario are small cap stocks. Small caps have seen strong performance since late last year, with the Russell 2000 Index returning 17.53% YTD and 54.38% since the end of September 2020. A decade of underperformance, strong GDP growth amid re-opening, and the more domestic revenue exposure of small caps fueled investor enthusiasm. Volatility in the small cap index halved since the latest October 2020 peak of 45%. One way for investors to stay in small caps amid inflation uncertainty is to look to covered call strategies on the Russell 2000. If volatility rises or the index trends sideways, covered calls historically tend to benefit.
Within the fixed income space, emerging market debt is an asset class to consider in the current environment. As the world turns the corner on COVID-19, EM economies should continue to make reopening progress, their fiscal positions improve, and tourism accelerate. In addition, elevated commodity prices from the first half (H1) of 2021’s inflation should help spur quicker economic recoveries. EM debt currently offers a 3.81% yield to worst8, well above the 10-year treasury rate of 1.47%.
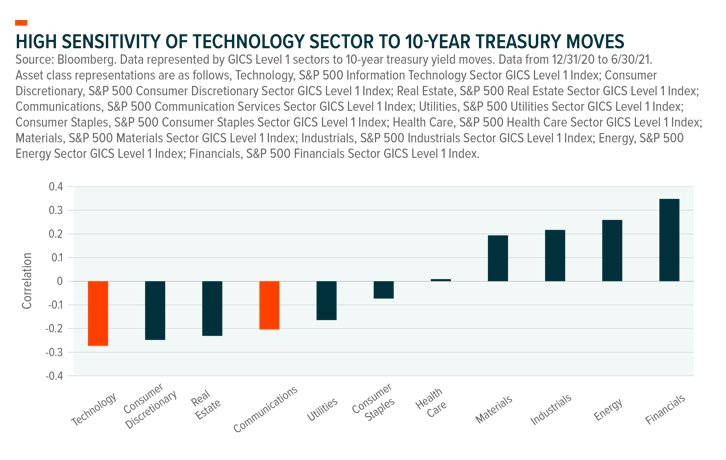
Last, if inflation proves to be transitory and long-term rates remain low, Growth stocks may continue their decade-long dominance. The bull case for Growth is that the abnormally high inflation readings in H1 are due to the ‘base effect’ from the pandemic and shorter term supply chain issues. If inflation normalizes to the 2% to 2.5% range, as expected by the Fed in 2022, longer term bonds could remain near pre-pandemic levels. However, if inflation figures remain elevated or volatile, Growth could be bumpy. Similar to small caps, covered calls on the Nasdaq 100 may help generate income while uncertainty in inflation results in Growth stock volatility. The index’s nearly 70% exposure to the sensitive Technology and Communication Services sectors makes it another way to capture unforeseen volatility in the treasury market.
Conclusion
Inflation uncertainty is a challenge for all investors, but perhaps none more than those depending on their portfolios for income. Strong economic data is just one piece of the equation as central bank actions, COVID-19 variants, and supply chain disruptions all factor into the inflation equation. In our view, investors may want to prepare for several scenarios. Real assets like MLPs and REITs currently offer high yields and are able to pass through input costs to customers, helping to insulate them from rising costs. Value and small caps can thrive if inflation increases, while Tech and Growth stocks may do well if inflation subsides. Preparing for noisy data in either direction could be addressed through covered call strategies that sell volatility. Outside of the United States, an improving global economic picture will likely benefit EM bonds.
This post first appeared on July 23 on the Global X ETF blog.
Photo Credit: Nicolas Raymond via Flickr Creative Commons
FOOTNOTES & DISCLOSURE
S&P 500 Information Technology Sector GICS Level 1 Index: The Index comprises those companies included in the S&P 500 that are members of the Global Industry Classification Standard (GICS) Information Technology sector. These companies include software & services, technology hardware & equipment, and industry groups that make up the Information Technology sector.
S&P 500 Consumer Discretionary Sector GICS Level 1 Index: The Index comprises those companies included in the S&P 500 that are members of the Global Industry Classification Standard (GICS) Consumer Discretionary sector. These companies include automobile & components, consumer durables & apparel, consumer services and retailing.
S&P 500 Consumer Staples Sector GICS Level 1 Index: The Index comprises those companies included in the S&P 500 that are members of the Global Industry Classification Standard (GICS) Consumer Staple sector. These companies include food & staples retailing, food, beverage & tobacco, household & personal products
S&P 500 Real Estate Sector GICS Level 1 Index: The Index comprises those companies included in the S&P 500 that are members of the Global Industry Classification Standard (GICS) Real Estate sector. These companies include equity real estate investment trusts and real estate management & development.
S&P 500 Communication Sector GICS Level 1 Index: The Index comprises those companies included in the S&P 500 that are members of the Global Industry Classification Standard (GICS) Communication sector. These companies include telecommunication services and media & entertainment.
S&P 500 Utilities Sector GICS Level 1 Index: The Index comprises those companies included in the S&P 500 that are members of the Global Industry Classification Standard (GICS) Utilities sector. These companies include electric utilities, gas utilities, water utilities, independent power and renewable electricity producer.
S&P 500 Health Care Sector GICS Level 1 Index: The Index comprises those companies included in the S&P 500 that are members of the Global Industry Classification Standard (GICS) Health care sector. These companies include health care equipment & services, pharmaceuticals, biotechnology and life sciences.
S&P 500 Materials Sector GICS Level 1 Index: The Index comprises those companies included in the S&P 500 that are members of the Global Industry Classification Standard (GICS) Materials sector. These companies include chemicals, construction materials, containers & packaging, metals & mining, and paper & forest products companies.
S&P 500 Industrials Sector GICS Level 1 Index: The Index comprises those companies included in the S&P 500 that are members of the Global Industry Classification Standard (GICS) Industrials sector. These companies include capital goods, commercial & professional services and transportation.
S&P 500 Energy Sector GICS Level 1 Index: The Index comprises those companies included in the S&P 500 that are members of the Global Industry Classification Standard (GICS) Energy sector. These companies include energy equipment & services, oil, gas, & consumable fuels.
S&P 500 Financials Sector GICS Level 1 Index: The Index comprises those companies included in the S&P 500 that are members of the Global Industry Classification Standard (GICS) Financials sector. These companies include banks, diversified financials, and insurance.
FTSE NAREIT All Equity REITS Index: A free float adjusted market capitalization weighted index that includes all tax qualified equity REITs listed in the NYSE, AMEX, and NASDAQ National Market.
Solactive MLP & Energy Infrastructure Index: The Solactive MLP & Energy Infrastructure Index tracks the performance of MLPs and energy infrastructure corporations.
Bloomberg Barclays EM USD Aggregate Total Return Index: A flagship hard currency Emerging Markets debt benchmark that includes fixed and floating-rate USD dollar-denominated debt issued from sovereign, quasi-sovereign, and corporate EM issuers. Investors can’t invest directly in indexes.
Endnotes
1. Bureau of Labor Statistics. Data for April to June 2021.
2. Bureau of Labor Statistics. Data for June 2021.
3. Bureau of Labor Statistics.
4. Bloomberg.
5. Bloomberg. Growth represented by MSCI USA Growth Index and Value represented by MSCI USA Value Index.
6. Bloomberg. MLPs represented by Solactive MLP Infrastructure Index and REITs measured by FTSE NAREIT All Equity REITs Index. Data as of 6/30/21.
7. Bloomberg. Data comparing 6/30/21 to 12/31/19. MLPs represented by Solactive MLP Infrastructure Index and REITs by FTSE NAREIT All Equity REITs Index. Based on forward EV/EBITDA metrics.
8. Bloomberg. EM Debt measured by Bloomberg Barclays EM USD Aggregate Total Return Index. Data as of 6/30/21.
18. Ibid.
DISCLOSURE
Investing involves risk, including the possible loss of principal. There is no guarantee the strategies discussed will be successful. International investments may involve risk of capital loss from unfavorable fluctuation in currency values, from differences in generally accepted accounting principles or from economic or political instability in other nations. Emerging markets involve heightened risks related to the same factors as well as increased volatility and lower trading volume. Narrowly focused investments may be subject to higher volatility. The funds are non-diversified.Information Technology companies can be affected by rapid product obsolescence, and intense industry competition. Risks include disruption in service caused by hardware or software failure; interruptions or delays in service by third-parties; security breaches involving certain private, sensitive, proprietary and confidential information managed and transmitted; and privacy concerns and laws, evolving Internet regulation and other foreign or domestic regulations that may limit or otherwise affect the operations. Healthcare, Genomics, Biotechnology and Medical Device companies can be affected by government regulations, expiring patents, rapid product obsolescence, and intense industry competition. CleanTech Companies typically face intense competition, short product life cycles and potentially rapid product obsolescence. The risks related to investing social media companies include disruption in service caused by hardware or software failure, interruptions or delays in service by third-parties, security breaches involving certain private, sensitive, proprietary and confidential information managed and transmitted by social media companies, and privacy concerns and laws, evolving Internet regulation and other foreign or domestic regulations that may limit or otherwise affect the operations of such companies. These companies may be significantly affected by fluctuations in energy prices and in the supply and demand of renewable energy, tax incentives, subsidies and other governmental regulations and policies. There are additional risks associated with investing in lithium and the lithium mining industry.


