By Lee Clements, head of sustainable investment solutions, FTSE Russell
Biodiversity is often relegated to a niche status in the world of sustainable investment priorities. As the UN COP15 biodiversity conference—which should have been happening this month in China—is delayed by the pandemic[1] until October, it should not be forgotten. Investors should take note of the importance biodiversity plays in both ecosystems and economies, its importance to other sustainability issues, particularly climate change, and the need to consider it as an integral part of the sustainable investment agenda.
At FTSE Russell we recognise that biodiversity is a key part of climate risk at the national level, environmental performance at the corporate level and an integral part of the green economy. That is why ecological resilience is a key sub pillar in our Climate Risk-Adjusted World Government Bond Index, biodiversity is one of the 14 themes in our corporate ESG scores and, in our Green Revenues Classification System, Organic & Low Impact Farming and Sustainable Forestry are outlined as micro sectors.
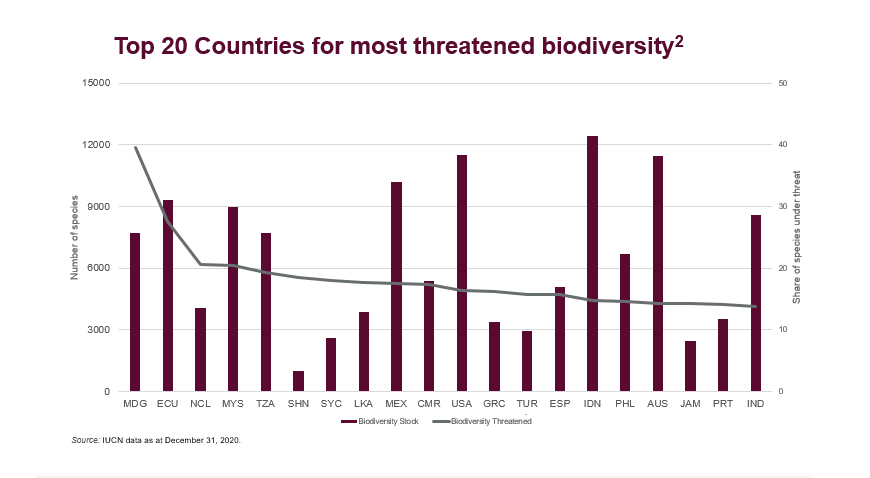
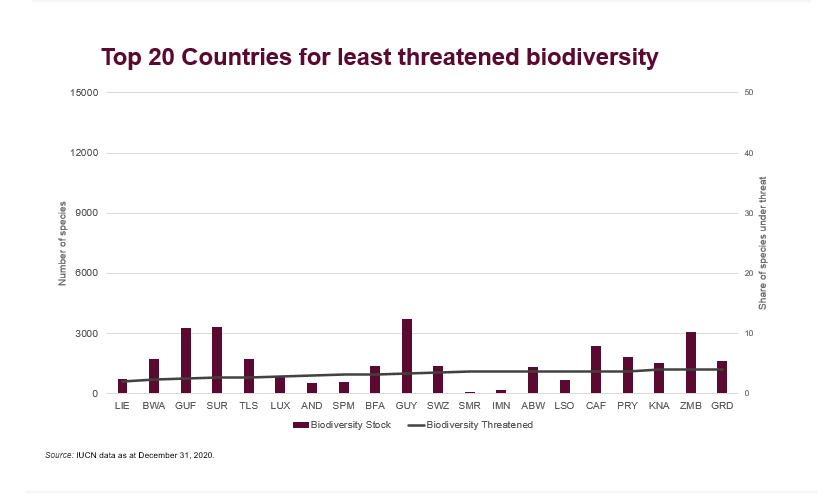
The above two charts show the top and bottom 20 countries in terms of the UN % of biodiversity threatened indicator together with their total biodiversity stock indicator (both of which are used within our measurement of ecological resilience). It highlights the degree to which investors can be exposed to countries with poor biodiversity exposure as it includes both smaller EM countries like Madagascar and Ecuador and large developed market countries like USA and Spain. Exposure to these poor performers will increasingly attract attention as biodiversity rises up the agenda, harming broader sustainability and climate commitments and potentially exposing themselves to sensitive industries in those countries such as food, agriculture and tourism.
By contrast focusing on areas of good biodiversity performance can boost performance to areas of sustainable growth such as sustainable agriculture, eco-tourism or biological carbon sequestration. However the second chart highlights the complexity investors can find with assessing biodiversity statistics, that the best performers in terms of threatened biodiversity have relatively low levels of biodiversity stock. As such it is important for investors to look at a range of data.
Biological diversity, through healthy ecosystems, provides critical services that support the world’s social and economic systems, such as crop, livestock and fish production, pollination, coastal protection and carbon sequestration, to name but a few[3]. As ecosystems are degraded this can have severe impacts on multiple sectors of the economy further translating into financial risks. According to the World Economic Forum, more than half of the world’s gross domestic product (US$44 trillion) is moderately or highly dependent on nature-related services[4].
The scale of the pressure on biodiversity is significant, from the loss of rainforests to wildlife being pushed to the margins of species representation by the human ever-increasing need for meat – 60% of mammals are livestock, for 36% of humans and only 4% of wild mammals[5]. Biodiversity concerns can very quickly also become hot political topics such as the sensitive issue of fishing in European politics, pressure on Brazil over Amazonian clearances or potential for the wild animal meat trade to drive pandemics.
Helping protect biodiversity is essential to the very long-term viability of certain business models. In the case of fisheries, the shares of overfished stocks and maximally sustainably exploited stocks already exceed 30% and 60%.
Biological overfishing slows down or halts the recovery of fish stocks and economic overfishing generates less wealth than could be obtained optimally. Based on the Gordon-Schaefer bioeconomic model, the World Bank estimated economic losses of about $83 billion in 2012, compared with the optimal global maximum economic yield equilibrium[6].
Biodiversity is also critical to the world’s ability to meet the goals of mitigating climate change. Agriculture, forestry and other land use are the source of 23% of global GHG emissions. There are further risks that degradation of ecosystems can release the huge amount of greenhouse gases stored in global forests and soils, however they are also unique in their ability to sequester massive quantities of carbon, a very valuable resource in the quest for ‘net zero’. Investors need to think of trees and plants in their climate change goals, not just renewables and electric vehicles.
However, just addressing the negative impacts on biodiversity to reduce losses (e.g. through fishing quotas or, in the case of investments, exclusion lists) may not be sufficient both in terms of ecosystem preservation and for the financial sustainability of portfolios. More active investment opportunities exist, as many sectors can now provide green products and services with biodiversity benefits.
The market for plant-based meat, which offers an alternative to animal-based products, is expected to grow from $4.3 billion in 2020 to $8.3 billion in 2025, a compound average growth rate (CAGR) of 14%[7]. Large corporates are now increasingly using tree planting as an integral part of their net zero commitments, such as Apple’s recently announced $200 million Restore Fund for forestry project[8].
Nonetheless, biodiversity remains a specialist area in finance and even the most committed asset managers may have difficulties to find relevant projects to turn their investments to. The green economy is still a growing market, while brown investments still receive direct support. In early 2020, the OECD determined that private and public funding supporting biodiversity is five to six times less than the subsidies damaging it (e.g. support for fossil fuels and government expenditure on agriculture, forestry or fisheries potentially harmful to the environment), which amount to about $US500 billion every year[9].
Biodiversity finance still lacks clarity on metrics, materiality and investment methodologies meaning it is often overlooked in the sustainable investment agenda. A clearer consensus on how to measure investment outcomes, for instance through a set of common indicators, is needed for it to become, if you’ll pardon the pun, a natural part of the sustainable investment ecosystem. Hopefully, the post-2020 global biodiversity framework to be discussed at COP 15 in October will bring about much needed global attention on an overlooked topic which, as its etymology reminds us, is a matter of life.
This post originally appeared on June 9 on the FTSE-Russell blog.
Photo Credit: yrjö jyske via Flickr Creative Commons
[1] IPBES (2020). IPBES workshop on Biodiversity and Pandemics, workshop report.
[2] The IUCN Red List of Threatened Species, Protected Area and Key Biodiversity Area data downloaded from the Integrated Biodiversity Assessment Tool (IBAT) (http://www.ibat-alliance.org). Provided by BirdLife International, Conservation International, IUCN and UNEP-WCMC.
[3] Millennium Ecosystem Assessment (2005). Ecosystems and Human Well-being: Synthesis. Island Press, Washington, DC.
[4] WEF & PwC (2020). Nature Risk Rising: Why the crisis engulfing nature matters for business and the economy.
[5] Yinon M. Bar-On et al. (2018) The biomass distribution on Earth. Proceedings of the National Academy of Sciences Jun 2018, 115 (25) 6506-6511.
[6] World Bank Group (2017). The Sunken Billions Revisited. Progress and Challenges in Global Marine Fisheries.
[7] MarketsandMarkets (2020). Plant-based Meat Market […] – Global Forecast to 2025.
[8] Apple (15 Apr. 21). Apple and partners launch first-ever $200 million Restore Fund to accelerate natural solutions to climate change. Press release.
[9] Organisation for Economic Cooperation and Development (OECD) (2020). A Comprehensive Overview of Global Biodiversity Finance.
© 2021 London Stock Exchange Group plc and its applicable group undertakings (the “LSE Group”). The LSE Group includes (1) FTSE International Limited (“FTSE”), (2) Frank Russell Company (“Russell”), (3) FTSE Global Debt Capital Markets Inc. and FTSE Global Debt Capital Markets Limited (together, “FTSE Canada”), (4) MTSNext Limited (“MTSNext”), (5) Mergent, Inc. (“Mergent”), (6) FTSE Fixed Income LLC (“FTSE FI”), (7) The Yield Book Inc (“YB”) and (8) Beyond Ratings S.A.S. (“BR”). All rights reserved.
FTSE Russell® is a trading name of FTSE, Russell, FTSE Canada, MTSNext, Mergent, FTSE FI, YB and BR. “FTSE®”, “Russell®”, “FTSE Russell®”, “MTS®”, “FTSE4Good®”, “ICB®”, “Mergent®”, “The Yield Book®”, “Beyond Ratings®” and all other trademarks and service marks used herein (whether registered or unregistered) are trademarks and/or service marks owned or licensed by the applicable member of the LSE Group or their respective licensors and are owned, or used under licence, by FTSE, Russell, MTSNext, FTSE Canada, Mergent, FTSE FI, YB or BR. FTSE International Limited is authorised and regulated by the Financial Conduct Authority as a benchmark administrator.
All information is provided for information purposes only. All information and data contained in this publication is obtained by the LSE Group, from sources believed by it to be accurate and reliable. Because of the possibility of human and mechanical error as well as other factors, however, such information and data is provided “as is” without warranty of any kind. No member of the LSE Group nor their respective directors, officers, employees, partners or licensors make any claim, prediction, warranty or representation whatsoever, expressly or impliedly, either as to the accuracy, timeliness, completeness, merchantability of any information or of results to be obtained from the use of FTSE Russell products, including but not limited to indexes, data and analytics, or the fitness or suitability of the FTSE Russell products for any particular purpose to which they might be put. Any representation of historical data accessible through FTSE Russell products is provided for information purposes only and is not a reliable indicator of future performance.
No responsibility or liability can be accepted by any member of the LSE Group nor their respective directors, officers, employees, partners or licensors for (a) any loss or damage in whole or in part caused by, resulting from, or relating to any error (negligent or otherwise) or other circumstance involved in procuring, collecting, compiling, interpreting, analysing, editing, transcribing, transmitting, communicating or delivering any such information or data or from use of this document or links to this document or (b) any direct, indirect, special, consequential or incidental damages whatsoever, even if any member of the LSE Group is advised in advance of the possibility of such damages, resulting from the use of, or inability to use, such information.
No member of the LSE Group nor their respective directors, officers, employees, partners or licensors provide investment advice and nothing contained in this document or accessible through FTSE Russell Indexes, including statistical data and industry reports, should be taken as constituting financial or investment advice or a financial promotion.
Past performance is no guarantee of future results. Charts and graphs are provided for illustrative purposes only. Index returns shown may not represent the results of the actual trading of investable assets. Certain returns shown may reflect back-tested performance. All performance presented prior to the index inception date is back-tested performance. Back-tested performance is not actual performance, but is hypothetical. The back-test calculations are based on the same methodology that was in effect when the index was officially launched. However, back- tested data may reflect the application of the index methodology with the benefit of hindsight, and the historic calculations of an index may change from month to month based on revisions to the underlying economic data used in the calculation of the index.
This publication may contain forward-looking assessments. These are based upon a number of assumptions concerning future conditions that ultimately may prove to be inaccurate. Such forward-looking assessments are subject to risks and uncertainties and may be affected by various factors that may cause actual results to differ materially. No member of the LSE Group nor their licensors assume any duty to and do not undertake to update forward-looking assessments.