

As we move into the summer months, our thoughts turn toward the pool and time outdoors. It is an apt metaphor to use then that indeed, at this time, it seems that everybody is already in the pool when it comes to the stock market.
In past letters I have written of the tendency of investors and speculators to jump into markets as they are peaking. Generally, it is greed that drives this fear of missing out (FOMO) on the gains that they see those around them making. This behavior tends to drive the most investment just as the least gains are available.
Capital Tsunami
Below is a chart of the amount of money that has come into the stock market over the life of this bull market. What we see is that in the months since the vaccine for the coronavirus was released more money has entered the stock market than in the prior 12 years combined.

In my opinion, that’s an astounding concentration of bets being placed on a bull market that is closer to the end of its life.
Bubbly
I have made the case that stock market bubbles provide opportunity for the investor. Typically, the normal business cycle will move a stock market from cheap valuations (a bear market) to expensive valuations (a bull market).
In a bubble, valuations are stretched far beyond what is normal for a bull market. Historically, the stock market has traded for approximately 1.1 times sales over the past 65 years. At the Internet bubble peak, the stock market traded for 2.2 times sales. Today, the latest reading for stock market valuations has us at 3.1 times sales.
In the past, a reading of just 1.3 would have been considered expensive. In my view, these valuations suggest that the stock market has pulled forward the expectations of future sales into the present. The stock market is counting its chickens before they have hatched. Counting chickens that have not hatched is not a successful investment strategy.
The next chart puts in stark terms the expected returns for today’s investors. The blue line is a forecast of the expected returns of the stock market over bonds in the coming 12 years.
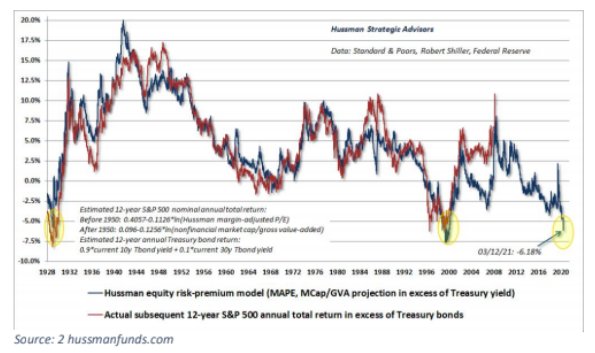
The red line shows what actually happened over the forecasted 12 years. As you would expect, the red line lags the blue line by the 12-year period of the forecast.
Over the nearly 100 years covered by this chart, what actually happens in the stock market closely follows the prediction of the blue line. At the peak of the stock market in 1929, the blue line forecast a loss of a little more than 5% per year over the subsequent 12 years.
The actual result was a loss of a little more than 7.5% per year. At the peak of the Internet bubble, the blue line predicted subsequent losses of 7.5% per year. The actual performance was a loss of ~6% per year. Today’s prediction is for losses of ~6.2% per year over the coming 12 years.
For those at or near retirement this prediction should be taken quite seriously. This is a time to be maximally cautious.
Bubble Opportunities
Typically, bubbles pop when conditions reveal that the premise of the bubble falls short of reality. When that happens the stock market simply falls of its own weight back down to long term valuations.
From today’s values, a drop to long term valuation norms implies a loss of approximately 70% or more. For the most expensive sectors of the stock market this might mean a loss of over 80%.
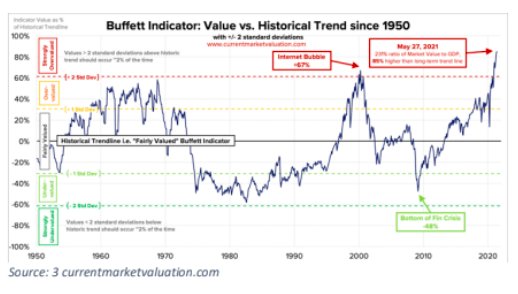
The chart below provides Warren Buffett’s favorite indicator for valuing the stock market. As of May 27th, the Buffett Indicator calculates that the market is 85% above its historical trend since 1950.
When the stock market as a whole goes through a severe correction everything is sold: the good, the bad and the ugly. That creates opportunities for those that have cash and/or are in safe-haven investments.
As the pendulum swings from overvaluation to undervaluation investors have the opportunity to buy at bargain prices.
Depending on the extreme of undervaluation, these opportunities have the potential to be life changing from a financial perspective. As the saying goes, in order to buy low and sell high, you first have to buy low.
Looking Ahead
In my opinion, this bubble has been fueled by the excitement of ever higher stock prices. Because of prior success or through imagined possibilities, the hottest sectors are bid up by investors. As Wall Street sees this demand, they issue more stock or bring new companies to the market in these sectors.
In the past year, that has meant new companies in the electric vehicle, green energy, and space sectors. Lately, crypto currencies with colorful names have garnered much attention.
Creating a glut of stock is one sure way to bring about the end of higher stock prices. With a glut of new supply and fewer and fewer people bidding up prices, markets fall back to earth. Since the beginning of the year, we have seen each of the above sectors lose between 34% and 50% from their highs.
In financial bubbles, the first sharp drop foreshadows the size of the overall bear market. If that is the case, in my view then the next couple of years will be disillusioning for many investors.
Photo Credit: Lars Plougmann via Flickr Creative Commons
Disclosure
This publication may contain forward-looking assessments, which are based upon a number of assumptions concerning future conditions that ultimately may prove to be inaccurate. Such forward-looking assessments are subject to risks and uncertainties and may be affected by various factors that may cause actual results to differ materially. This publication is provided as educational information only and is not intended to provide investment or other advice. This material is not to be construed as a recommendation or solicitation to buy or sell any security, financial product, instrument, or to participate in any particular trading strategy.
