

By George Milling-Stanley, Chief Gold Strategist
A clear understanding of the current situation in the gold market requires some historical perspective. As the chart below shows, for the six years from June 2013 to June 2019, gold traded predominantly in a range between about US$1,100 and US$1,350 an ounce.
For the final two years of that period, gold built a sizable head of steam, fueled by gradual increases in long-term strategic allocations coupled with “safe haven”1 buying in the face of perceived growing economic and political uncertainties. The price did not break out above the established trading range until Federal Reserve Chair Jerome Powell indicated at the June 2019 meeting of the Federal Open Markets Committee (FOMC) that he was planning to make what he referred to as a “mid-cycle adjustment” and reduce interest rates in July.
He said he based his decision on concern that the escalating tariff wars between the US and China might precipitate recession. As it turned out, of course, the Fed was soon faced with the economic dislocation caused by the COVID-19 pandemic and had no choice but to take much more drastic action.
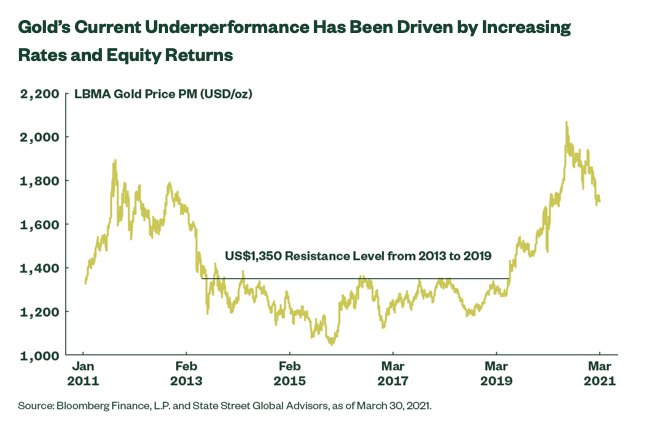
By the beginning of 2020, just six months after breaking out of its trading range, gold had already climbed above US$1,500 an ounce, US$150 above the level where the price had been capped for six years. These gains can be attributed to the continued building of long-term strategic positions and a significant acceleration of “safe haven” buying as the economic impact of the pandemic became increasingly apparent. Moving up gradually during the early months of 2020, by May gold had established itself firmly above the US$1,700 level. Then at the beginning of June the price really took off as speculative activity increased, and gold jumped more than US$300 by the first week of August to set a fresh all-time high close to US$2,070 an ounce.
Since then, gold has pulled back almost 20% from those heady levels.2 The first move down came on profit taking by speculators, and gold fell to US$1,850 before finding support. November saw two surprises for gold — eventual clarity on the results of the election removed uncertainty that had been supporting prices, and several announcements of vaccine progress were greeted with a response that was little short of euphoric. “Safe haven” buying subsided dramatically, as witnessed by substantial redemptions from gold-backed ETFs,3 and the price fell back toward the US$1,700 level. This year, gold has mostly traded above US$1,700, although the price drifted below that level briefly in March.
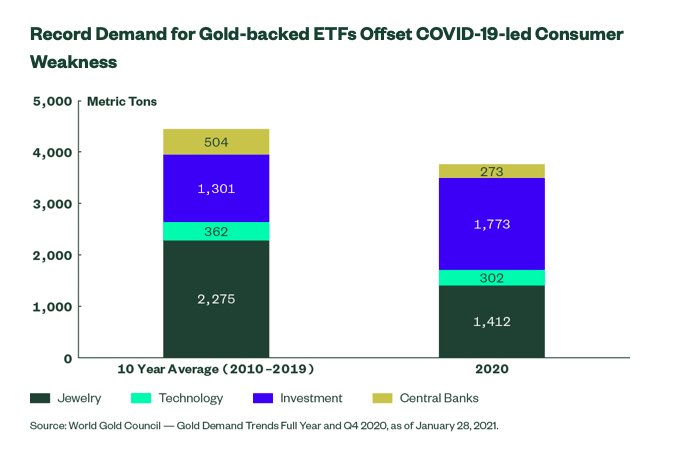
Apart from the pandemic and speculative activity, what other factors have been contributing to movements in the gold price? Developments in the demand and supply for the metal have also been directional. Last year, total global gold demand fell 14% to an 11-year low. Jewelry demand was down 34%, with the two largest consuming countries registering significant declines: demand in India fell 42%, and China was down 35%.4 These two countries account for more than half of gold’s global jewelry demand. By contrast, investment demand was 40% higher last year, with the traditional small bars and coins gaining 3%, and gold-backed ETFs up 120%.5 Net purchases by central banks were 60% lower year on year, but that comparison was skewed by the fact that purchases in 2019 were the highest in 50 years.6 Last year registered the 11th consecutive year of net purchases, mostly by central banks in the emerging world. The demand for gold in technological applications was 7% lower.7
In a typical year, jewelry accounts for 50-60% of total gold demand. As the chart below shows, that share fell to just 37.5% last year because of global lockdowns. And while investment typically runs between 20 and 30% of the total, last year it surged to 47.2%, helped by COVID-19-related perceived safe haven buying. Central bank net purchases have accounted for around 10% of total demand for the past decade, and they registered 7.3% last year. Demand for gold in technological applications, usually around 10% of the total, dipped to 8% last year in line with reduced levels of economic activity worldwide because of lockdowns.
Turning to the supply side, mine production emerged relatively unscathed even though the pandemic wreaked havoc on supply chains in many industries. Last year, gold mine production was down 4% and hit a five-year low.8 While there was some disruption from the virus, this drop also represented a continuation of a long-term secular trend of gradual declines in gold production
One encouraging note from all this is that there were signs of a nascent recovery in worldwide jewelry demand in the second half of 2020 from the multi-year lows reached in Q2. Several emerging market countries are having some success in reopening their economies right now. If that triggers a rebound in the region’s demand for gold jewelry, that could potentially be helpful for the gold price.
Answers to these three questions will be important in determining whether gold demand realigns closer to long-term trends in 2021 and beyond:
How will gold respond to fiscal policy?
Some investors wonder why gold did not rise significantly in response to the passage of the US$1.9 trillion rescue package. The simple answer is that the US dollar showed no consequent initial weakness in spite of the size of the package. It will be interesting to watch how gold reacts as more of the Biden Administration’s plans become reality, notably the proposals for an infrastructure stimulus package, a major reform of health care, and meaningful action to combat climate change. It sounds like a fairly typical Democratic agenda, but against the background of the pandemic, it will be a Democratic agenda on steroids. The White House currently estimates that this might add up to US$3 trillion. What will that lead to over the medium term? Likely wider deficits, higher debt, US dollar depreciation, and maybe even (finally!) inflation. Historically, gold has responded favorably when government actions have threatened to lead to sustained weakening in the US dollar. So far in 2021, that has not happened, but the US dollar showed signs of some weakness at the beginning of this year. Any return to a softening in the US dollar could help gold.
When will gold resume responding to monetary policy?
As noted, gold’s breakout above the US$1,350 top of the trading range in the summer of 2019 was a direct response to Fed Chair Powell’s decision to lower rates at the July FOMC meeting. Further Fed easing since then has been a major contributor to the strength in gold, culminating in the price reaching a fresh all-time high in August 2020. Mr. Powell has indicated that he plans to keep rates low “through 2023,” but independent of Fed action, rates at the longer end have risen substantially so far this year. That is currently exerting some downward pressure on gold prices, which may not recover until investor attention returns to real short-term rates remaining in negative territory. Negative real rates have historically been a strong positive for gold.
To read this article in its entirety, please click here. This post first appeared on April 9 on the State Street Global Advisors blog.
Photo Credit: K. Hurley via Flickr Creative Commons
Footnotes
1Assets may be considered “”safe havens”” based on investor perception that an asset’s value will hold steady or climb even as the value of other investments drops during times of economic stress. Perceived safe-haven assets are not guaranteed to maintain value at any time.
2Bloomberg Finance L.P., and State Street Global Advisors, as of March 29, 2021. Note: Gold is being measured by LBMA Gold Price PM (US$/oz).
3Bloomberg Finance L.P., and State Street Global Advisors, as of March 29, 2021.
4World Gold Council, “Gold Demand Trends: Full Year and Q4 2020,” as of January 28, 2021.
5World Gold Council, “Gold Demand Trends: Full Year and Q4 2020,” as of January 28, 2021.
6World Gold Council, “Gold Demand Trends: Full Year and Q4 2020,” as of January 28, 2021.
7World Gold Council, “Gold Demand Trends: Full Year and Q4 2020,” as of January 28, 2021.
8World Gold Council, “Gold Demand Trends: Full Year and Q4 2020,” as of January 28, 2021.
9Bloomberg Finance L.P., and State Street Global Advisors. Date range from August 15, 1971 to December 31, 2020. Note: Gold is being measured by LBMA Gold Price PM (US$/oz).
DISCLOSURE
Commodity funds may be subject to greater volatility than investments in traditional securities. Investments in commodities may be affected by overall market movements, changes in interest rates, and other factors, such as weather, disease, embargoes, and international economic and political developments.
This material is for your private information. The views expressed are the views of the SPDR® Gold Strategy Team and are subject to change based on market and other conditions. The opinions expressed may differ from those with different investment philosophies.


