

By Lee Clements, head of sustainable investment solutions
An industrial revolution is underway. The current high-carbon, resource-intensive global economy is gradually shifting toward a more sustainable economic model, in response to government policies, shifting consumer sentiment and the tumbling costs of lower impact technologies.
This revolution presents opportunity to investors and financial services firms. A growing number of investors are seeking exposure to companies that are set to profit from a more sustainable global economy. This revolution also poses regulatory risk as policymakers aim to promote investment in the green economy.

Accurately identifying the emerging green economy is far from straightforward. It requires agreement on what economic activities qualify as “green” and a calculation of revenues that each company earns from such activities. Fortunately, this is work we have been doing at FTSE Russell since 2008 – and our latest analysis shows a green economy that is becoming a significant part of the whole global economy and which has, over recent years, strongly outperformed wider indexes.
Green Economy
In December, we published the latest output of our FTSE Russell Green Revenues 2.0 (GR 2.0) Data Model. It tracks the exposure of around 3,000 listed companies around the world to the green economy. We define the green economy as comprising 10 sectors, including: energy generation; energy efficiency; environmental resources; sustainable food and agriculture; clean transport; waste and pollution control; and water infrastructure. These are further broken down into 64 subsectors and 133 micro sectors.
The headline finding is that, globally, the proportion of green revenues generated by those companies is equivalent to a market capitalization of US$4.3 trillion, or 5.4% of the total value of global listed equities. This makes the green economy materially larger than the oil and gas sector, which represents around 3% of the market. Critically, it is also broadly diversified, both geographically and by issuer size.
Green Superpowers
The US and China account for the largest percentage of the green economy, at levels in line with their share of the global equity market. Taiwan, Germany, Japan and France have high exposure relative to their size. Large-cap issuers account for two-thirds of the green economy, although green activities tend to generate only a small share of their revenues.
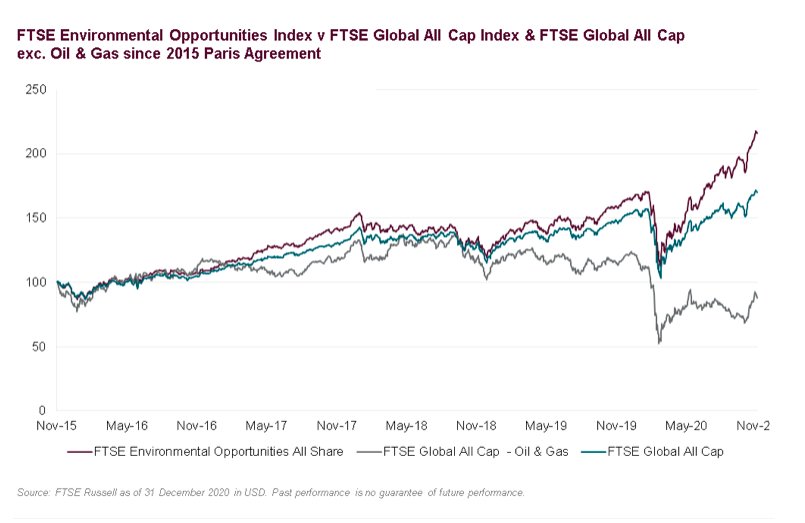
The green economy is growing rapidly. In 2009, when we first started tracking its size, its market cap stood at around US$2 trillion. Since then, it has grown at an annualized 8%, or around twice the rate of the broader economy. Specifically, in the two years to December 1, 2020, the FTSE Environmental Opportunities All Share index grew 60.4%, compared with 31.0% growth in the FTSE Global All Cap Index, and a fall of 26.8% in the Oil & Gas ICB Industry within the FTSE Global All Cap Index.
That growth is likely to accelerate. Despite the increase in the size of the green economy, it is still not large enough to deliver, for example, the goal enshrined in the Paris Agreement on climate change to hold global warming to less than 2°C above pre-industrial levels. We can expect redoubled policy efforts to meet this objective, which is likely to translate into strong growth for the green economy.
Why does all this matter? Firstly, from a purely regulatory standpoint, investment managers offering products in the EU need to track green revenues to comply with the new green taxonomy regulation. This is designed to encourage the flow of capital to companies providing environmental solutions by making it easier for investors to identify products that help provide that capital.
The EU green taxonomy identifies the economic activities that contribute to the EU’s environmental objectives—initially climate change mitigation and adaptation. The EU will require investment managers to disclose if they are using the Taxonomy to assess the sustainability of underlying investments and the proportion of those investments that are exposed to green economic activities.
Many investors also see opportunity in investing in the green industrial revolution. Identifying those companies most exposed can enable the creation of a range of investment products—from high-conviction, pure-play environmental markets funds through to more mainstream smart-beta strategies that track broad benchmarks but which incorporate a tilt towards companies exposed to the green economy.
It is still early days in the growth of the global green economy. It still represents just a small part of the whole. But, as investors search for growth over the decades to come, it could play an outsized role. Investors would be wise to understand its extent and track its evolution.
This article first appeared on February 11 on the FTSE Russell blog
Photo Credit: Matthias Ripp via Flickr Creative Commons
Disclosure
© 2020 London Stock Exchange Group plc and its applicable group undertakings (the “LSE Group”). The LSE Group includes (1) FTSE International Limited (“FTSE”), (2) Frank Russell Company (“Russell”), (3) FTSE Global Debt Capital Markets Inc. and FTSE Global Debt Capital Markets Limited (together, “FTSE Canada”), (4) MTSNext Limited (“MTSNext”), (5) Mergent, Inc. (“Mergent”), (6) FTSE Fixed Income LLC (“FTSE FI”), (7) The Yield Book Inc (“YB”) and (8) Beyond Ratings S.A.S. (“BR”). All rights reserved.
FTSE Russell® is a trading name of FTSE, Russell, FTSE Canada, MTSNext, Mergent, FTSE FI, YB and BR. “FTSE®”, “Russell®”, “FTSE Russell®”, “MTS®”, “FTSE4Good®”, “ICB®”, “Mergent®”, “The Yield Book®”, “Beyond Ratings®” and all other trademarks and service marks used herein (whether registered or unregistered) are trademarks and/or service marks owned or licensed by the applicable member of the LSE Group or their respective licensors and are owned, or used under licence, by FTSE, Russell, MTSNext, FTSE Canada, Mergent, FTSE FI, YB or BR. FTSE International Limited is authorised and regulated by the Financial Conduct Authority as a benchmark administrator.
All information is provided for information purposes only. All information and data contained in this publication is obtained by the LSE Group, from sources believed by it to be accurate and reliable. Because of the possibility of human and mechanical error as well as other factors, however, such information and data is provided “as is” without warranty of any kind. No member of the LSE Group nor their respective directors, officers, employees, partners or licensors make any claim, prediction, warranty or representation whatsoever, expressly or impliedly, either as to the accuracy, timeliness, completeness, merchantability of any information or of results to be obtained from the use of FTSE Russell products, including but not limited to indexes, data and analytics, or the fitness or suitability of the FTSE Russell products for any particular purpose to which they might be put. Any representation of historical data accessible through FTSE Russell products is provided for information purposes only and is not a reliable indicator of future performance.
The FTSE Environmental Markets Index Series provides investors with a focused way of defining and accessing the investment opportunities presented by the green economy.
The FTSE Global All Cap Index is a market-capitalisation weighted index representing the. performance of the large, mid and small cap stocks globally. Investors can’t invest directly in indexes.
No responsibility or liability can be accepted by any member of the LSE Group nor their respective directors, officers, employees, partners or licensors for (a) any loss or damage in whole or in part caused by, resulting from, or relating to any error (negligent or otherwise) or other circumstance involved in procuring, collecting, compiling, interpreting, analysing, editing, transcribing, transmitting, communicating or delivering any such information or data or from use of this document or links to this document or (b) any direct, indirect, special, consequential or incidental damages whatsoever, even if any member of the LSE Group is advised in advance of the possibility of such damages, resulting from the use of, or inability to use, such information.
No member of the LSE Group nor their respective directors, officers, employees, partners or licensors provide investment advice and nothing contained in this document or accessible through FTSE Russell Indexes, including statistical data and industry reports, should be taken as constituting financial or investment advice or a financial promotion.
Past performance is no guarantee of future results. Charts and graphs are provided for illustrative purposes only. Index returns shown may not represent the results of the actual trading of investable assets. Certain returns shown may reflect back-tested performance. All performance presented prior to the index inception date is back-tested performance. Back-tested performance is not actual performance, but is hypothetical. The back-test calculations are based on the same methodology that was in effect when the index was officially launched. However, back- tested data may reflect the application of the index methodology with the benefit of hindsight, and the historic calculations of an index may change from month to month based on revisions to the underlying economic data used in the calculation of the index.
