

By Helena Fung, head of sustainable investment, APAC
The appetite among domestic investors in Japan for ESG (environmental, social and governance) instruments has undoubtedly been gaining momentum.
The Japan Sustainable Investment Forum (JSIF) reports that total sustainable investment AUM rose to JPY336.4 trillion (USD3.1 trillion) in the 2019 fiscal period, marking a 45% jump from the previous year.[1]These assets, according to the Global Sustainable Investment Alliance (GSIA), represent 55.9% of the total professionally managed money in Japan,[2] up from just 3% in 2016.[3]

The GSIA credits progressive moves made by large institutional players, notably the country’s USD 1.5 trillion Government Pension Investment Fund (GPIF), along with the overhaul of the Japanese Stewardship Code, for encouraging asset managers to further integrate ESG principles into their portfolios and promote stronger governance standards across the board.[4]
Additionally, there is evidence to prove that aligning investments with morals and values can be just as profitable. Research conducted by the IMF shows that funds with a ‘sustainable mandate’ have returns similar to those of conventional equity funds.[5] Of course, those figures exclude the long-term benefits to the planet and communities accruing from measures such as reducing the carbon footprint, eliminating child labour or stamping out corruption.
Dissecting the reality
Do these trends prove that Japanese investors have fully integrated ESG measures into the investment process? A detailed look at the issue shows there is considerable room for improvement.
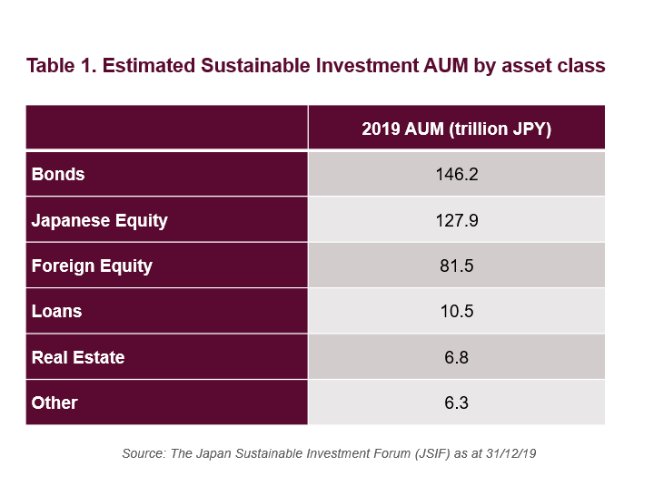
Bond investments, estimated at JPY 1.46 trillion (USD 1.35 trillion), represent the largest sustainable AUM by asset class, according to JSIF. This is largely due to the GPIF’s enhanced commitment to ESG integration across all asset classes, which includes a large allocation to Japanese government bonds. As commitments turn into further action, how sovereign bond investments are integrated with environmental and social concerns will be an interesting trend to monitor.
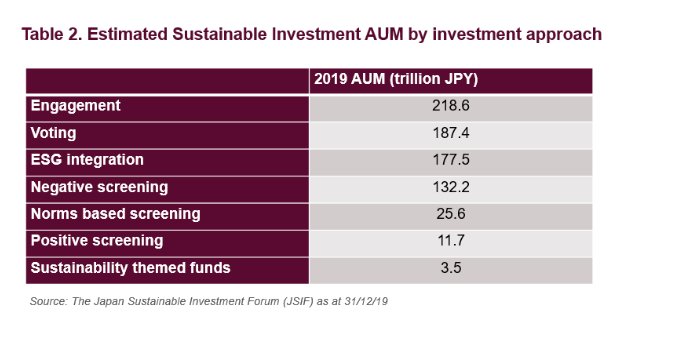
The second largest AUM tranche is that of domestic equity investments. One of the first steps of sustainable investment implementation for this asset class is thought to be engagement, which is the most common method of sustainable investment implementation in Japan representing an estimated AUM of JPY 218.6 trillion (USD 2.03 trillion)
In a market originally hesitant toward engagement activities, the increase in engagement efforts including participation in global initiatives such as Climate Action 100+ and keen alignment to the TCFD framework is encouraging. However, the relatively poor overall ESG performance of Japanese companies compared to key developed market peers shows that there is still room for such engagement efforts to result in market-wide higher levels of disclosure and action by the investee companies.[6]
Building a post-coronavirus market
Given the heft of Japan’s blue chip majors, in my opinion, there is a natural inclination to focus mainly on these firms and their ESG strategies. However, this can both mask risks in the wider market, as well as do a disservice to smaller companies who are taking proactive steps to enhance their visibility in this space.
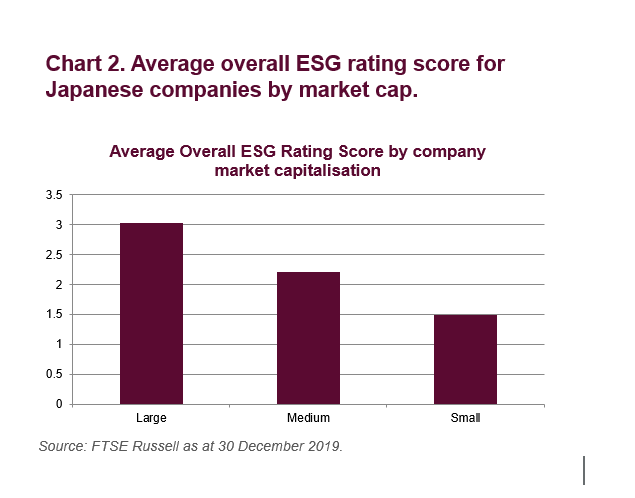
Admittedly, many small-cap companies face challenges in committing the same breadth of resources as their larger counterparts, whether that is systematically collating and disclosing the relevant data, or having the firepower to sustain ESG-appropriate performance. This could be a contributor to the clear overall underperformance by the smaller companies that are now covered by FTSE Russell’s ESG research for the first time (See Chart 2).
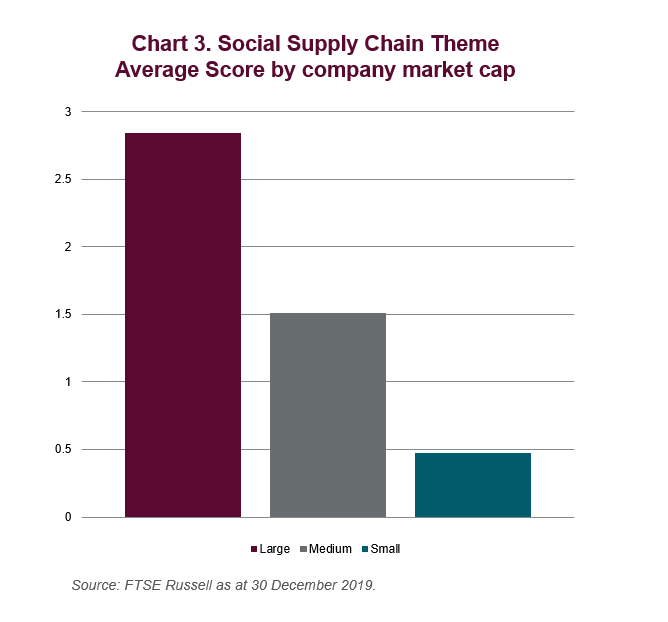
These underperformance trends by smaller companies are even more prominent when looking at how well they are managing their supply chain risks, such as monitoring, training, and managing the labor rights of their suppliers (See Chart 3). If nothing else, the recent outbreak of COVID-19 has heightened our attention to the importance of understanding the risks and opportunities inherent in global supply chains.
However, it may be too simplistic to look at the smaller companies in isolation. While listed in their own rights, mid- and small-market-cap companies are often subsidiaries or part of the global value chain of larger listed Japanese conglomerates. By understanding the ESG performance status of smaller Japanese companies, investors may fine-tune their engagement efforts with the larger companies to create a trickle down risk management effect.
Surveys of listed Japanese companies have shown that smaller companies that were not part of any assessment universe for ESG indexes did not have the necessary information or incentives necessary to drive action. On the other hand, including small caps in reputable ESG research coverage allows them to benchmark their position on a myriad of themes against their global peers.
Such metrics can guide executives on the changes that need to be made, and their extent, in order to plug gaps and boost their ESG credentials. FTSE Russell’s recent expansion to cover all small cap Japanese companies under the Global Equity Index Series, which almost doubles the research universe to approximately 1,300 securities, should provide helpful insights into the wider market.[7]
Such enhanced research and analysis—which is based on the same ESG rating methodology that forms the backbone to FTSE Blossom Japan, the flagship domestic ESG index—can facilitate advances in both recognition and demand from domestic investors on ESG issues; whether they choose to prioritize ESG principles in their overall decision-making, or pick specific themes to build portfolios around.
Overall, as regulators and authorities endeavor to create universal definitions and standards to realize the full potential of impact investing, the current uptrend in ESG-related financing is going to diversify and deepen, not only in Japan but around the world.
Photo Credit: Janet Ramsden via Flickr Creative Commons
References:
FTSE ESG Ratings: https://www.ftserussell.com/data/sustainability-and-esg-data/esg-ratings [8]
FTSE Blossom Japan Case Study: https://www.ftserussell.com/index/spotlight/ftse-blossom-japan-index
[1] https://japansif.com/survey;For the full Japanese report, go to http://japansif.com/2019survey-jp.pdf
[2] https://japansif.com/survey
[3] https://www.bloomberg.com/news/articles/2019-04-01/global-sustainable-investments-rise-34-percent-to-30-7-trillion
[4] http://www.gsi-alliance.org/trends-report-2018/
[5] https://www.cnbc.com/2019/10/10/imf-research-finds-esg-sustainable-investment-funds-dont-underperform.html
[6] Data from 30.12.2019. Average ESG Rating score of large and mid cap constituents in markets with more than 50 constituents within the FTSE Developed Index universe.
[7] https://www.ftserussell.com/press/ftse-russell-expands-sustainable-investment-analysis-china-and-japan
[8] https://www.ftserussell.com/data/sustainability-and-esg-data/esg-ratings
© 2020 London Stock Exchange Group plc and its applicable group undertakings (the “LSE Group”). The LSE Group includes (1) FTSE International Limited (“FTSE”), (2) Frank Russell Company (“Russell”), (3) FTSE Global Debt Capital Markets Inc. and FTSE Global Debt Capital Markets Limited (together, “FTSE Canada”), (4) MTSNext Limited (“MTSNext”), (5) Mergent, Inc. (“Mergent”), (6) FTSE Fixed Income LLC (“FTSE FI”), (7) The Yield Book Inc (“YB”) and (8) Beyond Ratings S.A.S. (“BR”). All rights reserved.
FTSE Russell® is a trading name of FTSE, Russell, FTSE Canada, MTSNext, Mergent, FTSE FI, YB and BR. “FTSE®”, “Russell®”, “FTSE Russell®”, “MTS®”, “FTSE4Good®”, “ICB®”, “Mergent®”, “The Yield Book®”, “Beyond Ratings®” and all other trademarks and service marks used herein (whether registered or unregistered) are trademarks and/or service marks owned or licensed by the applicable member of the LSE Group or their respective licensors and are owned, or used under licence, by FTSE, Russell, MTSNext, FTSE Canada, Mergent, FTSE FI, YB or BR. FTSE International Limited is authorised and regulated by the Financial Conduct Authority as a benchmark administrator.
All information is provided for information purposes only. All information and data contained in this publication is obtained by the LSE Group, from sources believed by it to be accurate and reliable. Because of the possibility of human and mechanical error as well as other factors, however, such information and data is provided “as is” without warranty of any kind. No member of the LSE Group nor their respective directors, officers, employees, partners or licensors make any claim, prediction, warranty or representation whatsoever, expressly or impliedly, either as to the accuracy, timeliness, completeness, merchantability of any information or of results to be obtained from the use of FTSE Russell products, including but not limited to indexes, data and analytics, or the fitness or suitability of the FTSE Russell products for any particular purpose to which they might be put. Any representation of historical data accessible through FTSE Russell products is provided for information purposes only and is not a reliable indicator of future performance.
No responsibility or liability can be accepted by any member of the LSE Group nor their respective directors, officers, employees, partners or licensors for (a) any loss or damage in whole or in part caused by, resulting from, or relating to any error (negligent or otherwise) or other circumstance involved in procuring, collecting, compiling, interpreting, analysing, editing, transcribing, transmitting, communicating or delivering any such information or data or from use of this document or links to this document or (b) any direct, indirect, special, consequential or incidental damages whatsoever, even if any member of the LSE Group is advised in advance of the possibility of such damages, resulting from the use of, or inability to use, such information.
No member of the LSE Group nor their respective directors, officers, employees, partners or licensors provide investment advice and nothing contained in this document or accessible through FTSE Russell Indexes, including statistical data and industry reports, should be taken as constituting financial or investment advice or a financial promotion.
Past performance is no guarantee of future results. Charts and graphs are provided for illustrative purposes only. Index returns shown may not represent the results of the actual trading of investable assets. Certain returns shown may reflect back-tested performance. All performance presented prior to the index inception date is back-tested performance. Back-tested performance is not actual performance, but is hypothetical. The back-test calculations are based on the same methodology that was in effect when the index was officially launched. However, back- tested data may reflect the application of the index methodology with the benefit of hindsight, and the historic calculations of an index may change from month to month based on revisions to the underlying economic data used in the calculation of the index.
This publication may contain forward-looking assessments. These are based upon a number of assumptions concerning future conditions that ultimately may prove to be inaccurate. Such forward-looking assessments are subject to risks and uncertainties and may be affected by various factors that may cause actual results to differ materially. No member of the LSE Group nor their licensors assume any duty to and do not undertake to update forward-looking assessments.
No part of this information may be reproduced, stored in a retrieval system or transmitted in any form or by any means, electronic, mechanical, photocopying, recording or otherwise, without prior written permission of the applicable member of the LSE Group. Use and distribution of the LSE Group data requires a licence from FTSE, Russell, FTSE Canada, MTSNext, Mergent, FTSE FI, YB and/or their respective licensors.


