

By Steve Sosnick, Chief Strategist at Interactive Brokers
A clear narrative throughout the markets involves the unprecedented wave of money that has flowed to financial assets from the Federal Reserve. The Fed’s balance sheet began to skyrocket in March at a rate that dwarfed even some of the largest recent liquidity injections.
If one believes that monetary expansion is a key – if not the key – to understanding market movements, then it is crucial to monitor the pace of that growth accommodation. The Federal Reserve issues a set of weekly statistics on Thursday afternoons, making it possible to do just that on a regular basis. Those releases can be found here.

Because those releases are in tabular form, it is easier to visualize the changes by graphing the results. I assert that the size and growth of the balance sheet are the key indicators to focus on, since the Fed may be increasing their purchases of one set of bonds (corporates) while reducing them in another (governments). Also, since bills and notes mature on a regular basis, some purchases may be required simply to keep the balance sheet constant.
Since a picture is said to tell a thousand words, here is a graph of the most recent results:
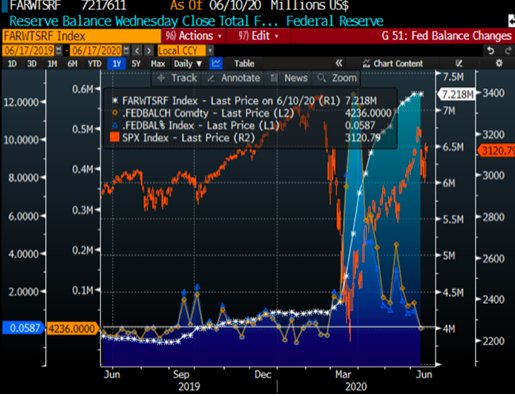
Source: Bloomberg
The white line shows the size of the Fed’s balance sheet on a weekly basis. It’s fairly obvious that the rate of growth has slowed over recent weeks. The blue and orange lines (they roughly coincide) show the week over week changes in the size of the balance sheet – orange is in absolute dollar terms (near left axis), blue is in percentage terms (far left axis).
It is too early to draw conclusions from these charts. The pace of increase in the Federal Reserve’s balance sheet has definitely slowed, but we don’t know whether that trend will persist or not. We also don’t really know whether the market is more focused on the absolute size of the balance sheet or its rate of growth. I suspect it’s the latter, but I am far from certain.
In any event, monetary policy seems to affect the stock market with a 2-3 week lag. If we need another couple of weeks to properly assess whether the Fed is indeed slowing its balance sheet growth, and then another 2-3 weeks for the markets to react, the narrative about an accommodative Fed should remain intact for a while.
Photo Credit: 401(k) 2012 via Flickr Creative Commons
DISCLOSURE: INTERACTIVE BROKERS
The analysis in this material is provided for information only and is not and should not be construed as an offer to sell or the solicitation of an offer to buy any security. To the extent that this material discusses general market activity, industry or sector trends or other broad-based economic or political conditions, it should not be construed as research or investment advice. To the extent that it includes references to specific securities, commodities, currencies, or other instruments, those references do not constitute a recommendation by IBKR to buy, sell or hold such investments. This material does not and is not intended to take into account the particular financial conditions, investment objectives or requirements of individual customers. Before acting on this material, you should consider whether it is suitable for your particular circumstances and, as necessary, seek professional advice.


