Despite a recent brief runup in September, US value stocks have been out of favor for some time now. With the US bull market going on almost 11 years, value stocks are struggling to keep up with their growth counterparts.
Looking at trailing periods ending in September this year shows that even as far back as 10 years, value is underperforming growth by a fairly large margin.
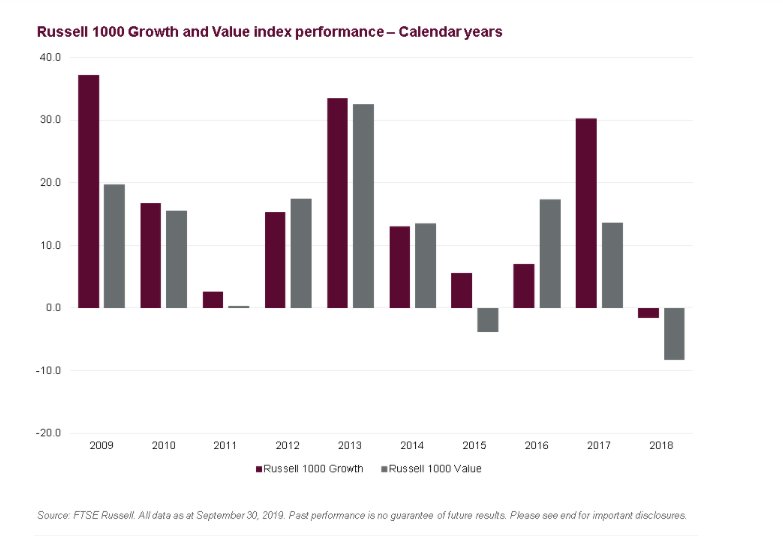
Value has outperformed growth in only 3 of the last 10 calendar years, most recently in 2016 as the uncertainty of the US presidential election raised concerns about the fate of the US economy and its impact on high-flying growth stocks.
Waning Fears
Those fears appear to have subsided substantially in 2017 and 2018, with the Russell 1000 Growth Index outpacing the Russell 1000 Value Index by 16.5 and 6.8 percentage points respectively, even despite the negative market environment that existed at the end of 2018.
Investors may be aware that there is substantial academic research supporting the existence of a “value premium”, whereby value stocks have been shown on average to outperform the broad market (and implicitly non-value or “growth” stocks) over a long time horizon.
Value Premium
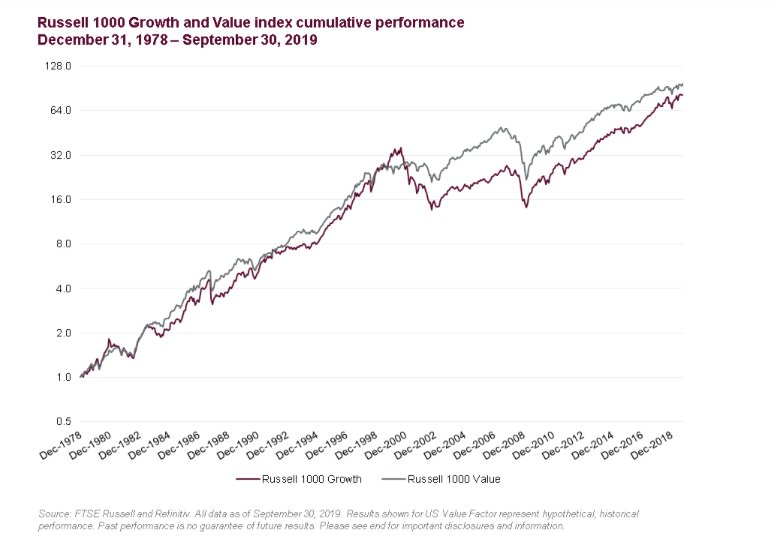
Does recent experience suggest that the value premium no longer exists? Not necessarily. Looking at over 40 years of performance for the Russell 1000 Growth and Russell 1000 Value Indexes appears to support the academic evidence of a value premium.
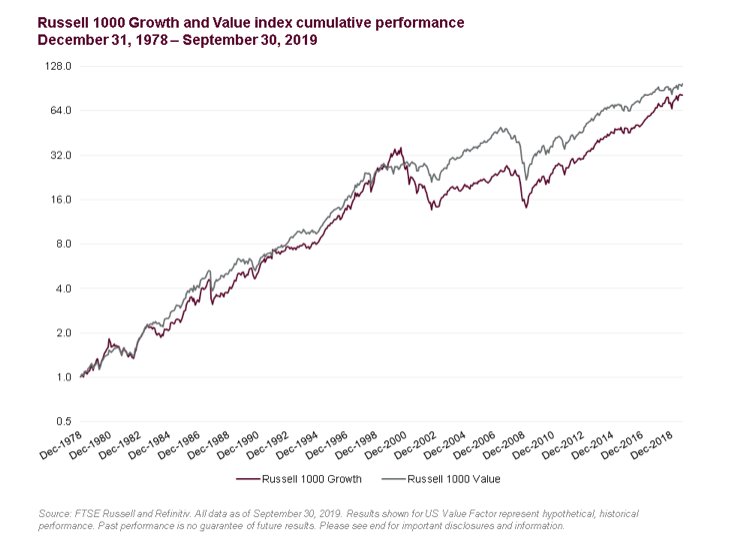
Except for some brief periods in the late 1980s and late 1990s, value stock performance has equaled or exceeded growth stock performance on a cumulative basis over the last 40+ years, by a margin of 46 basis points, annualized.
Most of the excess return to value came following the Technology/Media/Telecom (TMT) bubble as highly inflated valuations for growth stocks came back to earth over the next few years.
More recently, however, we can see that the cumulative spread between value and growth is decreasing, reflecting the more recent experience where growth has outperformed value.
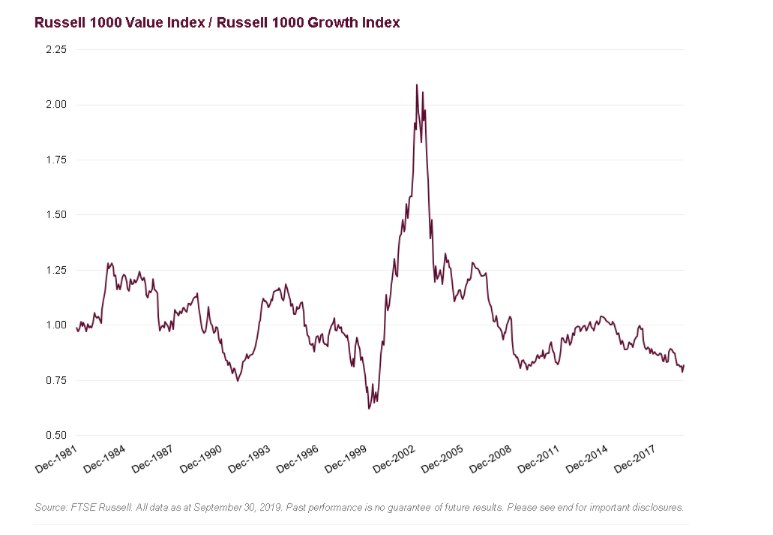
To avoid the risk of drawing conclusions from a single (albeit lengthy) time period, we can also look at value/growth performance cycles over shorter holding periods to assess the persistence of the value premium over shorter time frames.
Examining excess returns to value stocks over rolling 3 year holding periods shows that the value premium is not assured over shorter time horizons.
Dot.com Era
After experiencing a positive premium throughout most of the 1980s and the mid-1990s, value stocks began underperforming growth stocks by a large margin as valuations of companies driving the “new economy” were driven to unrealistic levels.
After the bubble burst in the early 2000s value experienced a resurgence, with a cumulative performance premium over twice that of growth. As the economy recovered this premium began to diminish and reversed in the late 2000s.
The value premium started to make a comeback after the Global Financial Crisis (GFC) of 2008-2009 but this was short lived as the US entered a prolonged bull market phase, and growth stocks began outperformance value stocks consistently.
So what is an investor to do? For those who believe the value premium will rise again, the best approach may be patience. The ability to weather market cycles can be rewarding. For others who don’t have the wherewithal or conviction to wait, perhaps the best approach would be to balance their portfolio between growth and value stocks in consideration of the natural diversification that this provides.
This post first appeared on October 29 on the FTSE Russell blog.
Photo Credit: Pictures of Money via Flickr Creative Commons
© 2019 London Stock Exchange Group plc and its applicable group undertakings (the “LSE Group”).
All information is provided for information purposes only. All information and data contained in this publication is obtained by the LSE Group, from sources believed by it to be accurate and reliable. Because of the possibility of human and mechanical error as well as other factors, however, such information and data is provided “as is” without warranty of any kind.
No member of the LSE Group nor their respective directors, officers, employees, partners or licensors make any claim, prediction, warranty or representation whatsoever, expressly or impliedly, either as to the accuracy, timeliness, completeness, merchantability of any information or of results to be obtained from the use of FTSE Russell indexes or research or the fitness or suitability of the FTSE Russell indexes or research for any particular purpose to which they might be put.
Any representation of historical data accessible through FTSE Russell indexes or research is provided for information purposes only and is not a reliable indicator of future performance. No member of the LSE Group nor their respective directors, officers, employees, partners or licensors provide investment advice and nothing contained in this document or accessible through FTSE Russell Indexes, including statistical data and industry reports, should be taken as constituting financial or investment advice or a financial promotion.