

Matthew J. Bartolini, CFA, Head of SPDR Americas Research, State Street Global Advisors
Manufacturing represents around 10% of overall gross domestic product (GDP) in the US. However, when the sector sends signals, they can indicate much larger issues for the broader economic landscape. Think of those manufacturing signals like a car’s check engine light—when all is well, you don’t notice it. But when it’s sending a signal, you had better pay attention.
The most recent US manufacturing data turned the light decidedly on. In this edition of Charting the Markets, we will examine the recent trends in manufacturing data and how its path and pace may affect interest rate levels, equity returns, and global earnings growth.

Manufacturing data and bond yields
Despite the Citi Economic Surprise Index turning positive for the first time since February, manufacturing has not played a part in that rebound.1 The ISM Manufacturing Purchasing Managers’ Index (PMI) Index fell to its lowest point since 2009, sinking deeper into a contractionary phase of below 50. September marks the sixth straight month of declines, and all of this is coinciding with a reduction in global manufacturing, where an index of similar data is also below 502, as the US-China trade war constrains economic momentum all over the world.
With manufacturing indicating a more glacial and sluggish path for growth, long-term interest rates have moved in tandem – a relationship that is historically common as shown below. Long-term rates, after all, will reflect the market’s forward expectation for growth and inflation as an investor will demand a higher yield to lock up their money for a longer period of time where those dynamics can change and impact the principal, rather than own shorter maturity bonds. This is called the term premium, and right now term premiums are vastly negative – the most negative they have ever been back to 1961.3
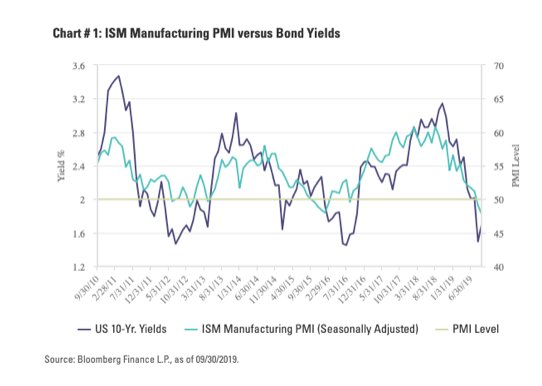
With this backdrop and relationship, the ceiling for bond rates is likely to remain constrained.
Manufacturing data and market returns
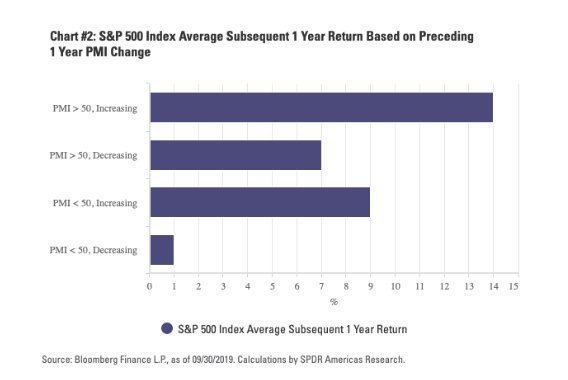
Weak manufacturing data has tended not to bode well for equity market returns. But the data does not have to just be weak; it also has to be weakening. As shown in the chart below, breaking out PMI by its different levels and direction can provide insight into what may lie ahead given the current situation. With PMI less than 50 and declining, historically, the subsequent 1-year return on the S&P 500® Index has been just 1%.4 With the month of October already starting off with a 1% loss , following the release of the aforementioned weak PMI data, the trend of lower future returns in a waning manufacturing sentiment and economic growth may persist into 2020.
Manufacturing data and earnings expectations
Trade woes and the decline in manufacturing activity both at home and abroad will likely lead to an earnings recession through the end of Q3. The US, however, is not the only one harmed by the US-China trade impact, as the chart below shows emerging market nations have seen full-year 2019 earnings-per-share (EPS) estimates decline from 12% a year ago, to just below zero today. Additionally, guidance has been weak for all considered regions—all analyst 2019 EPS up-to-downgrade ratio are below 1, indicating more downgrades than upgrades—as of September 30.
This article was first published on the FTSE Russell blog on October 8.
Photo Credit: Angus MacRae via Flickr Creative Commons
This material is from State Street Global Advisors and is being posted with State Street Global Advisors’ permission. The views expressed in this material are solely those of the author and/or State Street Global Advisors and Interactive Advisors is not endorsing or recommending any investment or trading discussed in the material. The opinions expressed may differ from those with different investment philosophies. This material is not and should not be construed as an offer to sell or the solicitation of an offer to buy any security. To the extent that this material discusses general market activity, industry or sector trends or other broad-based economic or political conditions, it should not be construed or relied on as research or investment advice. To the extent that it includes references to specific securities, commodities, currencies, or other instruments, those references do not constitute a recommendation to buy, sell or hold such security. This material does not and is not intended to take into account the particular financial conditions, strategies, tax status, investment horizon, investment objectives or requirements of individual customers. Before acting on this material, you should consider whether it is suitable for your particular circumstances and, as necessary, seek professional advice.
Photo Credit: Angus MacRae via Flickr Creative Commons


