

By Christopher Vass, senior product manager, FTSE Russell
Amid the trade tension that has been felt globally, one star in Asia has been glowing ever brighter. Vietnam has emerged as one of the fastest growing countries in the East.
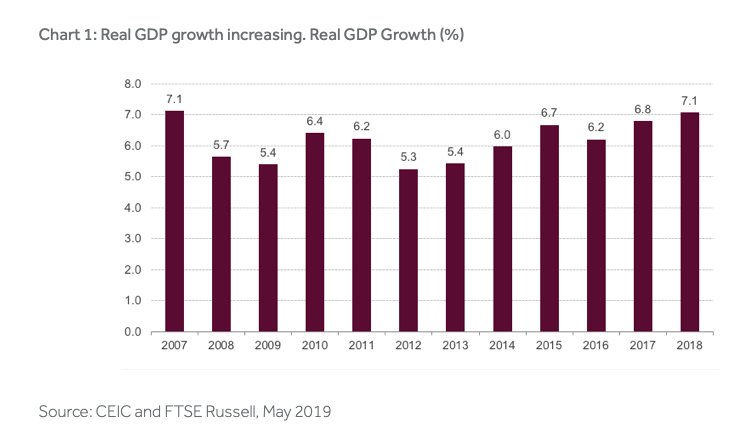
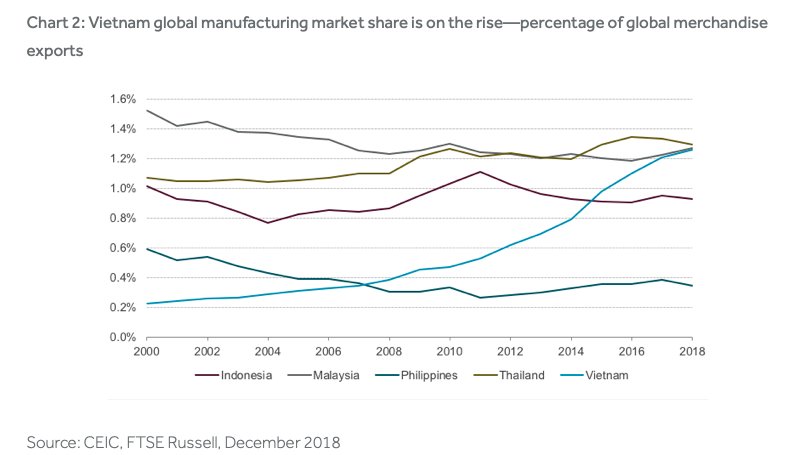
As shown in Chart 1 & 2, Vietnam’s real GDP growth was 7.1% in 2018, the highest growth rate in more than a decade and only beaten by India in the region.
Production Hub
This economic expansion is mainly driven by Vietnam’s transformation into a global manufacturing hub.
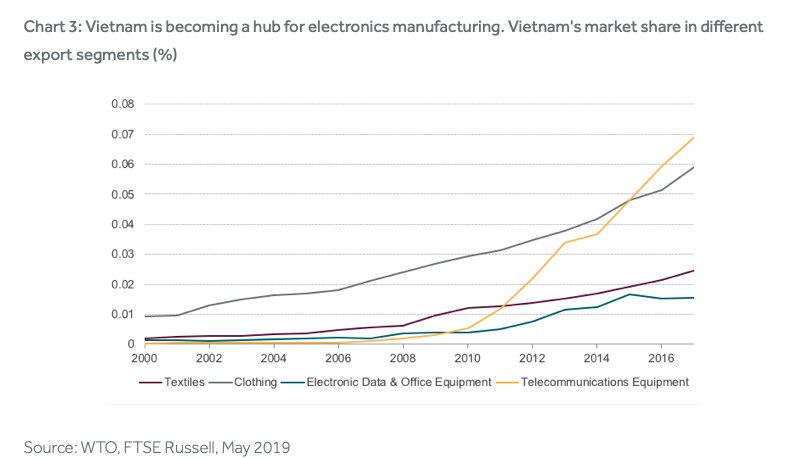
Chart 3 shows that Vietnam has surpassed many of its neighbors as a global merchandise exporter and is one of the few countries in the region that continues to grow its global market share.
None of these trends are likely to be hindered by the recent EU free trade agreement, which was signed on June 30 in Hanoi.
Export Juggernaut
Exports have continued to increase this year as Vietnam has recorded positive growth year-over-year during four out of the five months this year as seen in Chart 4.
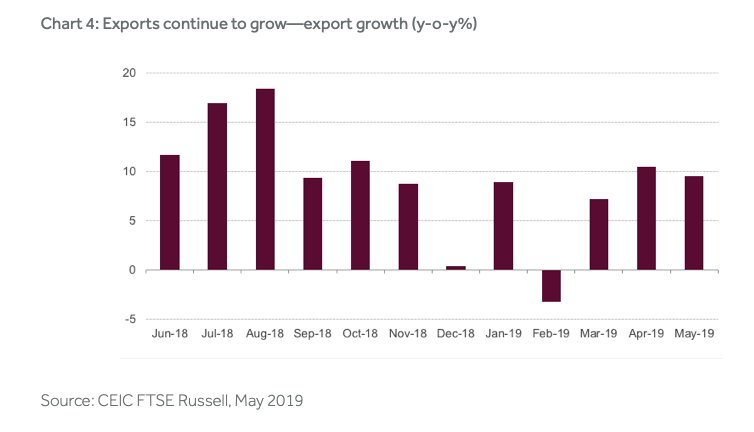
This is makes Vietnam stand-out in the region and helps make the case that Vietnam is one of the few countries that are benefiting from the relocation of manufacturing due to the recent trade tensions.
As an example, exports to the US grew with more than 35% the first quarter of this year compared to a year earlier.
Stock Market
In chart 5, it is apparent that the Vietnam equity market suffered less during the heightened volatility in May due to the trade tensions.
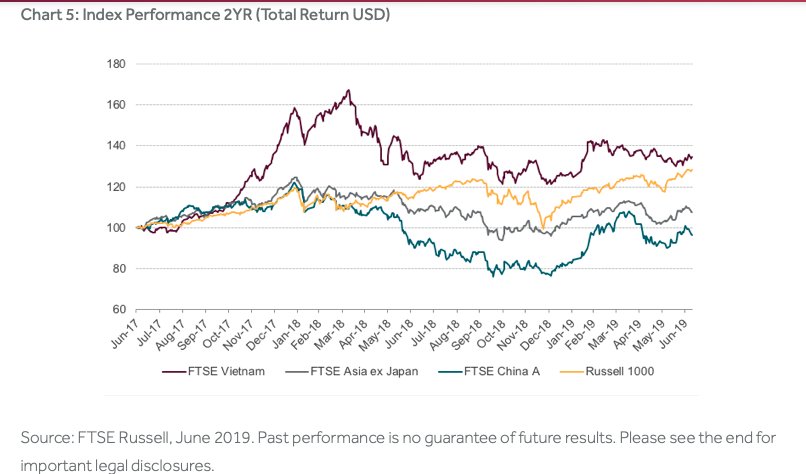
The FTSE Vietnam Index managed to almost stay flat in May, in stark contrast to other Asian equity indexes that were down almost 10% over the month.
Photo Credit: guido da rozze via Flickr Creative Commons
This article first appeared on the FTSE Russell blog on July 25.
© 2019 London Stock Exchange Group plc and its applicable group undertakings (the “LSE Group”).
All information is provided for information purposes only. All information and data contained in this publication is obtained by the LSE Group, from sources believed by it to be accurate and reliable. Because of the possibility of human and mechanical error as well as other factors, however, such information and data is provided “as is” without warranty of any kind.
No member of the LSE Group nor their respective directors, officers, employees, partners or licensors make any claim, prediction, warranty or representation whatsoever, expressly or impliedly, either as to the accuracy, timeliness, completeness, merchantability of any information or of results to be obtained from the use of FTSE Russell indexes or research or the fitness or suitability of the FTSE Russell indexes or research for any particular purpose to which they might be put.
Any representation of historical data accessible through FTSE Russell indexes or research is provided for information purposes only and is not a reliable indicator of future performance. No member of the LSE Group nor their respective directors, officers, employees, partners or licensors provide investment advice and nothing contained in this document or accessible through FTSE Russell Indexes, including statistical data and industry reports, should be taken as constituting financial or investment advice or a financial promotion.


