The US stock market is finishing 2017 on a strong note, what with the Dow Jones Industrial Average and S&P 500 Index up 17% and 22%, respectively, as of Dec 5.
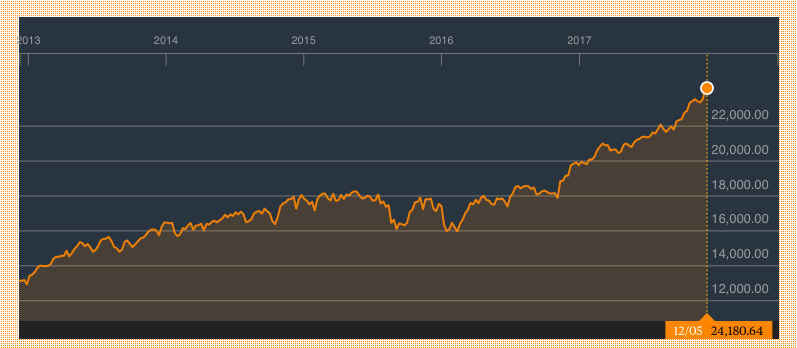
The current bull market’s momentum is more awesome when you take a longer view.
Take a look at this interesting chart pulled together by Bespoke Investment Group.
Big Mo
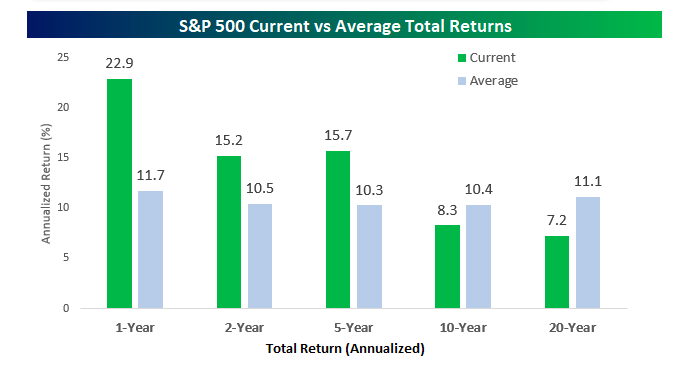
First off, over the past 12-month period ending on Nov. 30, the S&P has finished in positive territory every month.
On top of that, the S&P’s 22.9% gain is roughly double the historical average of 11.7% for the same period.
Going back two years, the S&P has advanced 15%, well above the average of 10.5%.
Ditto for a 5-year time frame: The S&P smoked the historical average.
Takeaway
The current US bull market that got underway in March of 2009 is the second longest in history.
It’s also one with tremendous energy based on its momentum relative to historical gains.
But now consider that over a 10- and 20-year timeframe, the S&P has lagged relative to the average.
According to Bespoke, that’s a reflection of the impact of the US financial crisis and dot.com bust.
As the team at Bespoke puts it:
The US equity market has obviously exited the dark ages of the early 2000s, but the scars, however faded they have become, are still there. Only time can heal.
Photo Credit: Robert Sullivan via Flickr Creative Commons