

The Covestor Rockledge L2 portfolio ended the third quarter essentially flat, gaining 0.65% after fees and fund expenses. By comparison, the benchmark S&P 500 Index returned 0.62% for the same period.
So what’s not working?
Bond yields
For one thing, low interest rates have driven investors to the stock market. With bond yields low, and with not much room for capital appreciation, investors have been moving into equities.
This inflow has contributed to rising stock prices, which, in turn, has attracted more investor capital in the last couple of years.
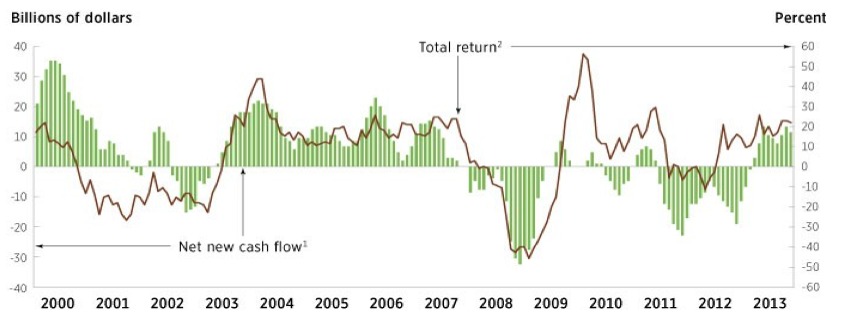
During 2008, investors began leaving equities. Equity markets bottomed in March 2009, and began to rebound.
Investors largely stayed away from equities through 2012, according to the chart below from the 2014 Investment Company Fact Book.
High Correlation
They began to come back into stocks in 2013, and then, pour money into equities in 2014.
This inflow of capital has led to high correlation levels in the marketplace.
Correlation by most measures (stock-to-stock, industry-to-industry and sector-to-sector) has been higher than historical levels. High correlations distort the historical relationships between stock prices and fundamentals like earnings.
In our opinion, the current correlation level has hurt our selections of late. Sector allocations tend to perform better when correlations across stocks and sectors are lower.
On average, the return of Rockledge L2 portfolio has been highly correlated to the returns of the S&P 500 Index. Rockledge L2 correlation has been in the 0.80 to 0.90 range, which is considered a high level.
Dispersion
Which brings us to dispersion, a measure of variability and risk associated with a particular security or investment portfolio.
Our premise is that there is always ‘alpha’ in the markets. There is always a way to outperform the market by selecting assets that are undervalued versus avoiding assets that are overvalued.
Furthermore, we believe that markets are cyclical, as are the underlying industries. Through the end of the third quarter, the S&P 500 is up some 6% this year.
The highest sector return has been 15% return in Healthcare (XLV), while the lowest return has been from the Consumer Discretionary (XLY) sector, essentially 0%. That works out to dispersion rate of 15%. (Here’s how you get there: 15%-0% = 15%.)
Historically, the Rockledge L2 Strategy has performed best when correlations were low, and dispersion was high.
For example, in 2005, the difference between the highest and lowest sector return was 46% (energy +40% and consumer discretionary -6%).
This dispersion rate crept to 56% in 2007, and remained near 40% for 2008 and 2009.
Today, the dispersion in the market is 15%. This is indicative of the higher correlations, which we believe is fueled by the sizable inflows into equities.
Volatility
Another factor influencing the portfolio is volatility. One measure of that is CBOE Volatility Index (VIX), a statistical measure of uncertainty derived from the S&P 100 Index.
The VIX is a measure of volatility today. It quantifies if there is fear in the market. This year it has been running at historical lows, in the range of 10 to 15.
When an event occurs, like an ISIS beheading or Russia lining up troops along the Ukraine, it may jump to 20. It was over 50 in 2008.
Another is volatility indicator is the standard deviation of returns. Typically it measures daily or monthly returns. If markets do not fluctuate wildly, one could expect a low figure.
This year, the volatility of daily returns has been low (10%-13%) relative to historical measures (15% to 17%). In 2008 and 2009, the standard deviation of the S&P 500 Index was measured in the 40s.
How has this impact Rockledge L2 thus far?
Since 2008 and 2009, the markets have been reacting to an unusual set of circumstances. Government intervention in the healthcare and financial services sector eclipsed historical relationships.
Budget issues in the U.S. led to a shutdown of the government. Fiscal stimulus with historically low interest rates for several years has distorted market relationships as well.
The impact of a potential Greek default, the rise of China to the number two global economy, and the Arab Spring have further added to these uncertainties.
On defense
But the equity markets have gone up, and volatility, by most measures, has remained low. It is hard to imagine a more uncertain time that now, yet volatility is at historic lows.
Rockledge L2 has felt for some time, many of the factors we analyze for our L2 Strategy have been out of line with historical trends.
So, more than four years into a bull market, Rockledge has been positioned more defensively.
The portfolio has held more defensive ETFs like Energy Select Sector SPDR Fund (XLE), Consumer Staples Select Sector SPDR Fund (XLP) and even Utilities Select Sector SPDR Fund (XLU) which have underperformed relative to the Healthcare Select Sector SPDR Fund (XLV) and the Technology Select Sector SPDR Fund (XLK).
We maintain the belief that the marketplace will return to normal correlations, more consistent volatility and the bull market eventually wind down, rewarding our defensively positioned strategy.
DISCLAIMER: The investments discussed are held in client accounts as of September 31, 2014. These investments may or may not be currently held in client accounts. The reader should not assume that any investments identified were or will be profitable or that any investment recommendations or investment decisions we make in the future will be profitable. Past performance is no guarantee of future results.

