“So far, so good.” – An optimist falling from a skyscraper
Thankfully, 2008 has become a distant memory. The S&P 500 Index (SPX) has made back its 37% loss and a lot more. Things are good, but are they going to stay that way?
We still face anemic economic growth, burgeoning debt, global social unrest, and more. No one knows what the future will bring, so let’s enjoy the good news while we can. The S&P 500 has returned 145% in the past 55 months (4.5 years). It just doesn’t get much better than that.
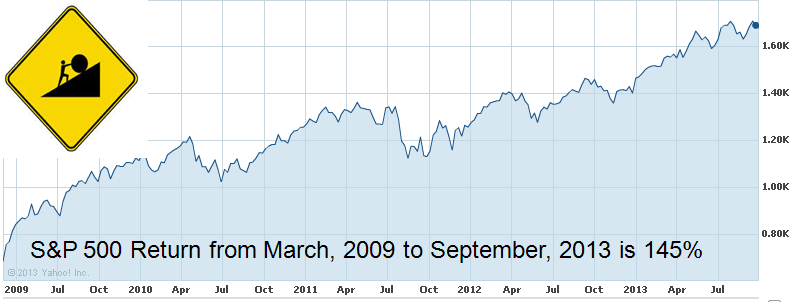
Source: Yahoo Finance (graph) and PPCA (warning sign)
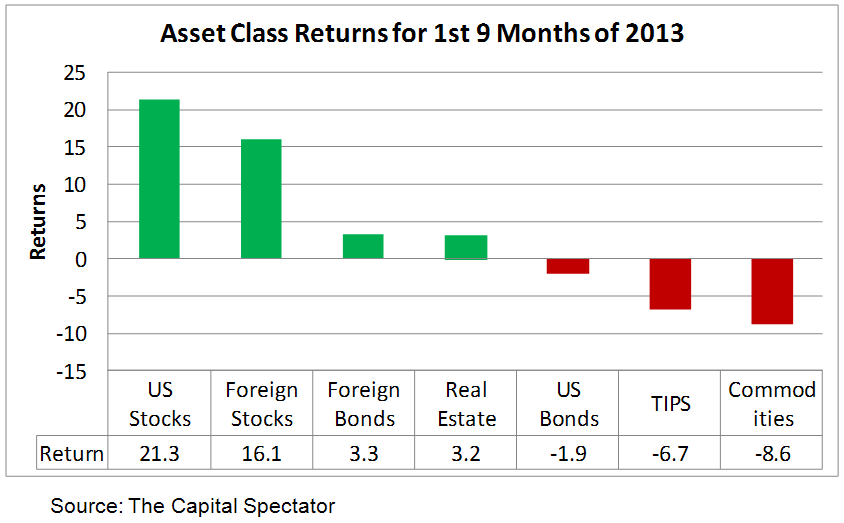
As for the more recent past, U.S. stocks earned 6% in the third quarter of 2013, bringing the year-to-date return up to a lofty 21%. The MSCI EAFE Index did even better in the quarter, earning 12%, bringing its year-to-date return up to 16%.
In fact, as shown in the following graph, no other major asset class comes close to the return on U.S. stocks so far this year. Although, upon closer inspection we find that Japan has outperformed the U.S. and Europe has matched us. Will this dominance continue?
U.S. Stocks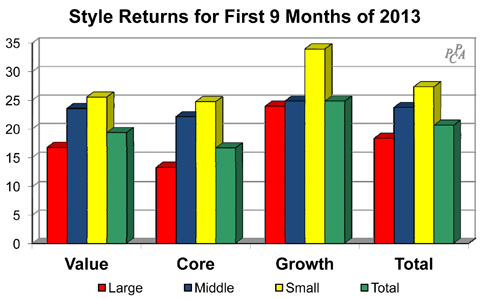
Growth stocks have led the way in 2013. Small-cap growth stocks performed best, earning 35%. By contrast, large-cap core companies earned only 13%, and large value earned “only” 17%. Other than these extremes, style returns clustered around 23%, a pretty good place to be. This has been one of those unusual periods where the “stuff in the middle” (core) has not performed in line with the “stuff on the ends.” I use Surz Style Pure® classifications throughout this commentary.
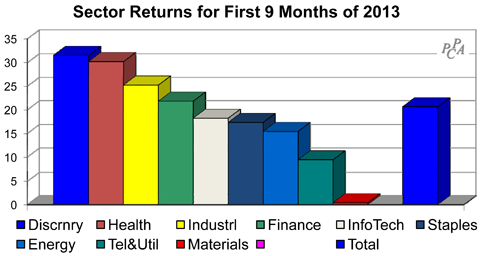
On the sector front, consumer discretionary and health care fared best, earning more than 30%. By contrast, materials eked out a measly 0.4%, and telephones-&-utilities also lagged with a 9% return.
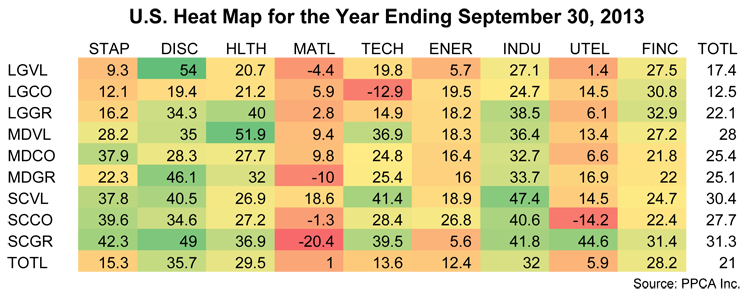
But the interesting details lie in the cross-sections of styles with sectors, especially if we are interested in exploiting momentum effects. In Searching for Alpha in Heat Maps, published in early April, I showed how heat maps could be used, and went out on a limb to forecast future winners and losers, based on momentum in heat maps for the year ending just prior to each quarter.
The forecast for this third quarter is my third forecast, and I am keeping score. I’ll report the results for the full year in my fourth quarter commentary. A heat map shows shades of green for “good,” which in this case is good performance relative to the total market. By contrast, shades of red are bad, indicating underperformance. Yellow is neutral.
Looking forward to the fourth quarter, the table below is the heat map for the year ending September 30, 2013. We see that the best performing market segment was comprised of large value companies in the consumer discretionary sector, earning 54%.
And the worst performing segment was small cap growth in the materials sector, losing 20.4%. Many quantitative managers employ momentum in their models, buying the “green” and selling the “red.” Fundamental managers use heat maps as clues to segments of the market that are worth exploring, for both momentum and reversal potential.
So I’ll go out on a limb again and forecast the following winners and losers for the next quarter. I’ll continue to track the results on a cumulative and quarterly basis. Let the games continue.
| Forecasts for U.S. Markets in Q4 2013 | |
| High | Low |
| Large Value Consumer Discretionary | Small-Cap Growth Materials |
| Mid-Cap Value Healthcare | Small-Cap Core Utilities & Telephone |
| Small-Cap Value Industrials | Large-Cap Core Technology |
Foreign Stocks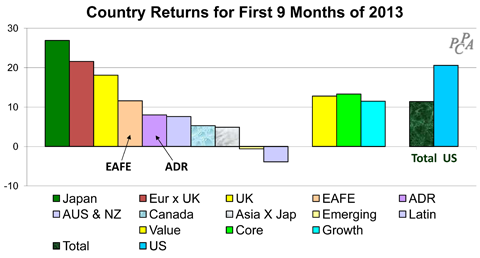
Looking outside the US, foreign markets earned 11%, lagging the U.S. stock market’s 21% return and matching EAFE’s return. Japan’s Nikkei 225 Index has been the big story, earning 27% in U.S. dollar terms. The return in Japanese yen was an even more impressive 40%. The Japanese stock market has soared this year as the yen was weakening against the dollar. Europe was not far behind Japan, earning 21%, matching the U.S. return. By contrast, all countries outside Europe and Japan earned less than 10%, and Latin America lost 4%.
On the style front, core surprised, as it did in the U.S., but core led rather than lagged, although not by much.
Certain information contained in this presentation is based upon forward-looking statements, information and opinions, including descriptions of anticipated market changes and expectations of future activity. The manager believes that such statements, information and opinions are based upon reasonable estimates and assumptions. However, forward-looking statements, information and opinions are inherently uncertain and actual events or results may differ materially from those reflected in the forward-looking statements. Therefore, undue reliance should not be placed on such forward-looking statements, information and opinions.