

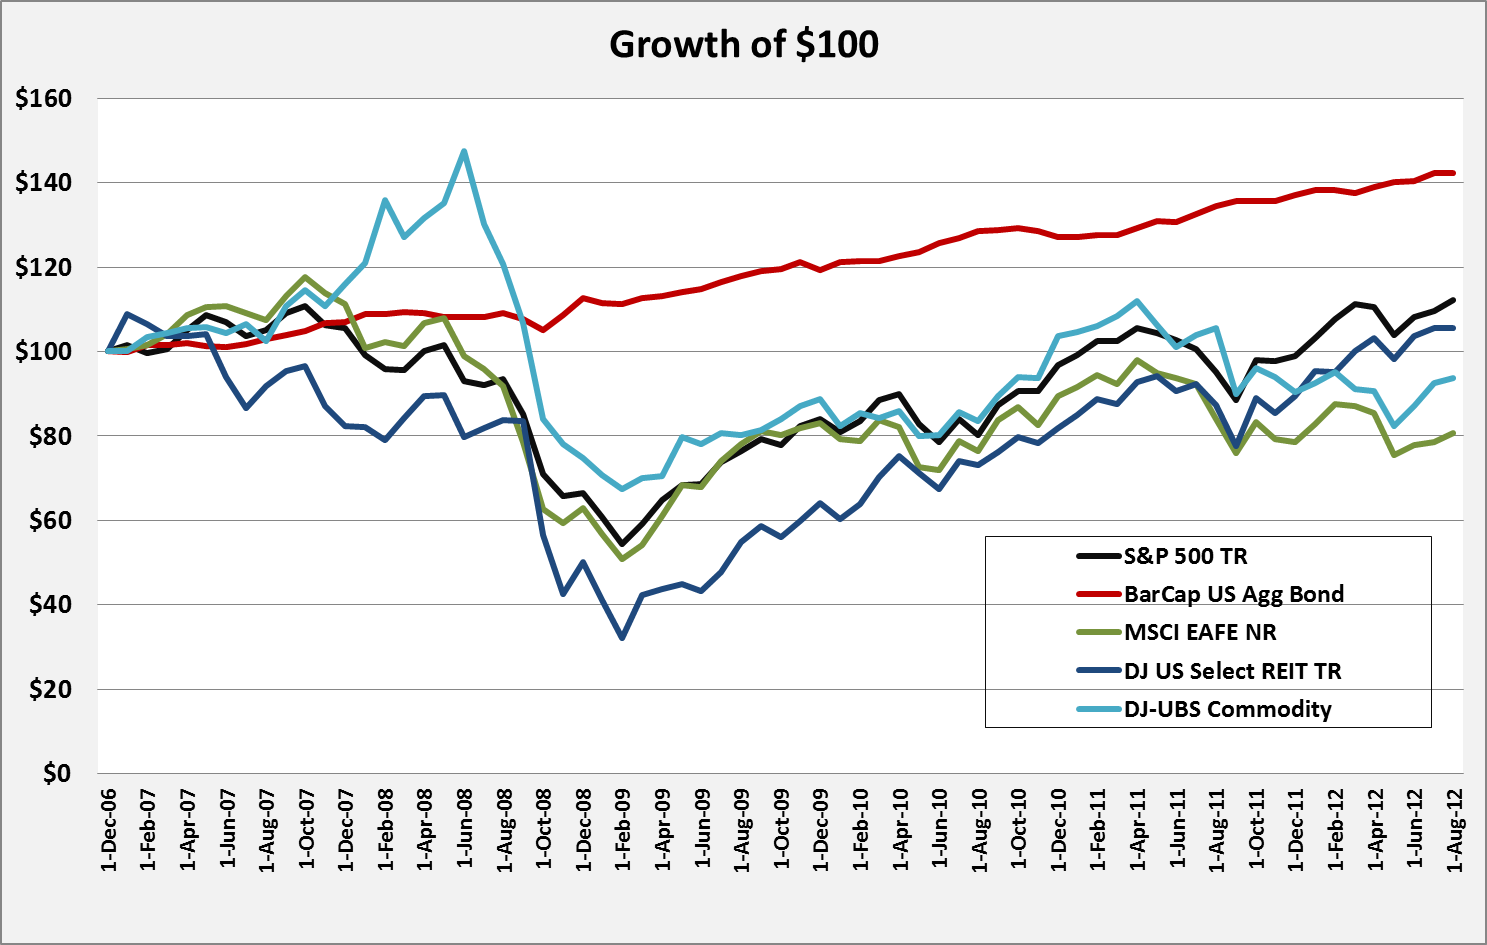
John Coumarianos’ chart of the day at Institutional Imperative. Coumarianos adds that it shows “the staggering run of bonds more than anything else.”
John Coumarianos’ chart of the day at Institutional Imperative. Coumarianos adds that it shows “the staggering run of bonds more than anything else.”
The unraveling of WeWork’s financial picture is a warning to investors
Gold saw a significant turning point in October, with the spot price rising 7.32% in the US$/oz, the largest monthly gain since March 2023.
Headline CPI rose 8.6% on a year-over-year (YoY) basis
Another great sketch from Carl Richards: From Richards’ newsletter accompanying the sketch: We love control. You name it, we’d probably prefer to […]


