

By: Jose Torres, Senior Economist
Stocks are getting crushed as investors consider the risks of an expanded trade conflict upon corporate America’s profitability. Traders are picking up the risk-off playbook in response to Washington implementing levies on products from Canada, China and Mexico by scooping up Treasurys, equity volatility protection and certain commodities. The new duties arrive as folks are increasingly worried about the endurance of the US consumer, which is also coinciding with government spending reductions that may weigh on the employment picture. Concerns over the durability of household outlays have been reflected in hard economic data, sentiment surveys and earnings calls, driving recession fears as investors increasingly price in more rate cuts from the Fed this year. Our IBKR ForecastTrader prediction market expects 50 to 75 bps of benchmark reductions from the central bank in 2025 on the back of angst about a potential slowdown that could drive the unemployment rate north. Despite the turbulence that cross border disputes can cause on economic conditions, meanwhile, the Trump administration is adamant about leveling the playing field for global commerce, hoping that accepting pain in the short term offers higher revenue collections amidst a robust recovery in stateside manufacturing activity.
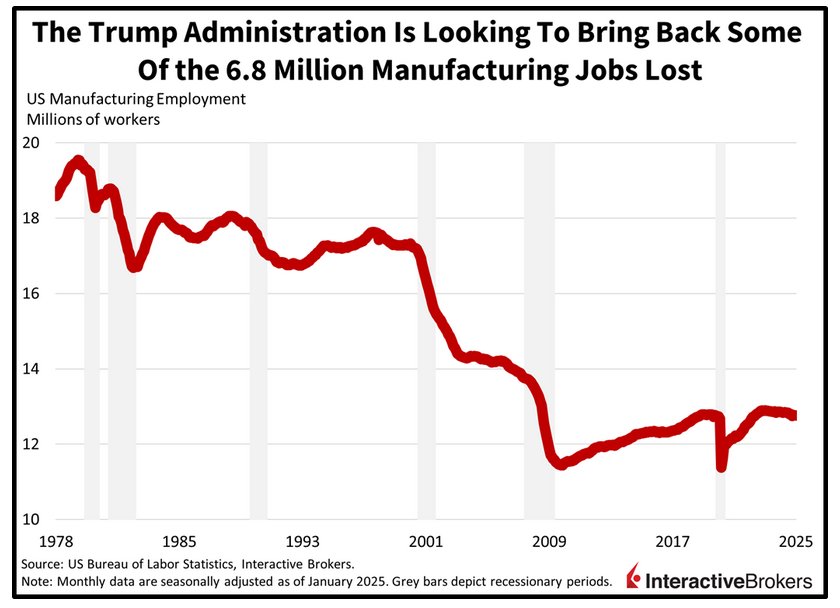
A Manufacturing Renaissance?
The Trump administration’s new tariffs may incentivize manufacturers to set up shop in the states, potentially helping to fuel a recovery in goods-producing employment domestically, which is down 6.8 million jobs since the high in 1979. But one of the major reasons voters gave President Trump another chance at the Oval Office was the painful inflationary pressures experienced under the Biden government; cost forces that could return to stress American households as trade conflicts threaten to burden consumers and producers alike, make goods commerce less efficient, stress supply chains and generate geopolitical tensions. Meanwhile, consumption momentum has waned significantly to start 2025 and the strain of heavier charges risk an economic downturn. Furthermore, goods have been the reliable component of disinflation and the landscape can’t afford the segment to reinflate considering that services remain problematic. Elevated rents and mortgages as well rising wages stemming from a tight labor market and immigration restrictions continue to bolster services inflation.
Investors Shelter from Trade War Fears
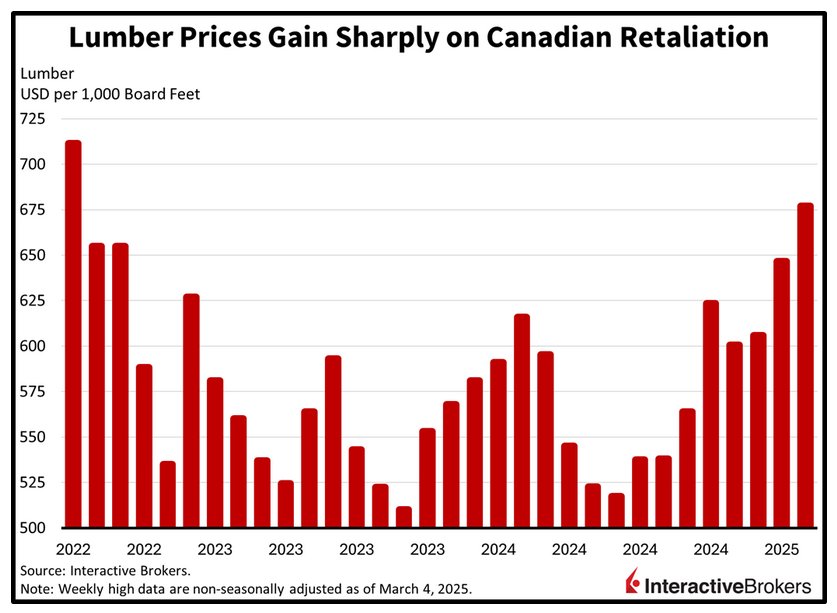
Risk assets are taking sharp losses as trade tensions weigh on the earnings outlook for US stocks, leading to investors favoring Treasurys, lumber and gold bars. The yield curve is shifting in bull-steepening fashion as softening economic conditions and rising uncertainty prompt expectations of a faster walk down the monetary policy stairs. Meanwhile, the lumber commodity is seeing interest due to it being a major Canadian import and gold is catching bids, thanks to its safe-haven status. Elevated equity volatility levels are also coinciding with traders scooping up long puts as insurance in case stocks continue declining.
Russell 2000 Leads Benchmarks South
Leading the losses in domestic equity benchmarks is the small-cap Russell 2000 index, which is cyclically oriented and tends to suffer when economic prospects begin to dwindle; it’s down 2.3%. The Dow Jones Industrial, S&P 500 and Nasdaq 100 gauges aren’t too far behind, losing 1.7%, 1.6% and 1.3%. Every major sector and sub-sector is getting sold with financials, consumer discretionary and industrials taking the most pain; they’re lower by 3.7%, 2.6% and 2.4%. Weakening growth projections are weighing on the greenback and serving to push yields lower, with the Dollar Index down 32 basis points (bps) as the US currency depreciates relative to most of its major counterparts, including the euro, pound sterling, franc, and yuan, but it is appreciating versus the loonie and Aussie tender. In commodities, economically sensitive crude oil and copper materials are facing the strongest selling pressure: they’re down 1.4% and 1.1% while silver is also lower by a more modest 0.4%. Lumber and gold are gaining 1.8% and 0.5%, the former is trading at its loftiest price in roughly two and a half years while the latter is close to its all-time high.
Yelling For Fed Cuts
One front and center risk with the “trade reset” is that physical goods will become increasingly unaffordable for American families, which would weigh on consumption volumes and potentially push the nation into recession. Today’s fierce bull-steepening across the yield curve is emblematic of the vulnerability and represents a yell for help from fixed-income watchers who are shouting to the Fed that this economy needs rate cuts right here, right now. Given the concerns of a consumer slowdown, the Treasury complex has shifted to a lower profile on growth worries and lighter term premiums due to government spending reductions, pointing to the principal susceptibility to this economy stemming from outlays falling off a cliff rather than price pressures regaining steam. Finally, consumer spending exhaustion and government expenditure reductions are worse for equities than inflation, as the former forces weigh on earnings momentum while the latter’s impact drives profits north, all else equal.
International Roundup
Industrial Activity and Retailing Fall in Korea
South Korea’s political disarray and uncertainties about trade tariffs caused both industrial production and retail sales to turn negative in January, according to Statistics Korea. Industrial output declined 2.3% and 4.1% month over month (m/m) and year over year (y/y), respectively, compared to gains of 3.9% and 4.4% in the final month of 2024. Analysts anticipated m/m and y/y declines of 3.1% and 2.0%. The metric primarily consists of manufacturing, mining, and utilities. While fears of trade tariffs and impeachment proceedings against the country’s leaders have weighed on sentiment, the January Lunar New Year celebration also impacted production by reducing the number of hours that factories operated.
Also in January, the country’s retail sales index sank m/m, falling 0.6% in January after climbing 0.2% in the preceding month. Home appliances, vehicles and other durable goods were a bright spot, but the gains didn’t fully offset declines in nondurable goods, semi-durable goods and cosmetics.
Japan’s Capital Expenditures Soften
Capital investment in Japan weakened on a y/y basis during the final quarter of 2024 after jumping 8.1% during the three-month period ended in September. In other developments, Japan’s unemployment rate and the number of individuals seeking work relative to job openings both increased in January while consumer confidence fell. A tight labor market and uncertainty regarding globe trade are believed to have driven a 0.2% y/y decline in capital spending, despite corporations generating strong profits. Analysts expected an increase of 4.9%.
Japan also experienced a modest January uptick in its unemployment rate, with the statistic inching up from 2.4% to 2.5% and its ratio of jobs relative to individuals seeking work climbing from 1.25 to 1.26. In both instances, analysts expected no change from December. Additionally, consumer confidence eroded slightly last month, falling from 35.2 to 35.0 compared to the forecast of 35.7. The survey of 8,400 households hit its lowest result since the spring of 2023. Within the index, satisfaction with overall livelihood sank 0.3 points to 31.9. Willingness to buy durable goods also dropped, hitting 27.2 after the preceding month’s score of 27.5. Conversely, individuals are more optimistic about employment, with the category’s score climbing from 41 to 41.1, but sentiment regarding income growth declined from 39.9 to 39.7.
Originally posted on March 4, 2025 on Traders’ Insight
PHOTO CREDIT: https://www.shutterstock.com/g/Ordent+Visuals
VIA SHUTTERSTOCK
DISCLOSURES
Disclosure: Interactive Brokers Affiliate
Information posted on IBKR Campus that is provided by third-parties does NOT constitute a recommendation that you should contract for the services of that third party. Third-party participants who contribute to IBKR Campus are independent of Interactive Brokers and Interactive Brokers does not make any representations or warranties concerning the services offered, their past or future performance, or the accuracy of the information provided by the third party. Past performance is no guarantee of future results.
This material is from IBKR Macroeconomics, an affiliate of Interactive Brokers LLC, and is being posted with its permission. The views expressed in this material are solely those of the author and/or IBKR Macroeconomics and Interactive Brokers is not endorsing or recommending any investment or trading discussed in the material. This material is not and should not be construed as an offer to buy or sell any security. It should not be construed as research or investment advice or a recommendation to buy, sell or hold any security or commodity. This material does not and is not intended to take into account the particular financial conditions, investment objectives or requirements of individual customers. Before acting on this material, you should consider whether it is suitable for your particular circumstances and, as necessary, seek professional advice.
Disclosure: ForecastEx
Interactive Brokers LLC is a CFTC-registered Futures Commission Merchant and a clearing member and affiliate of ForecastEx LLC (“ForecastEx”). ForecastEx is a CFTC-registered Designated Contract Market and Derivatives Clearing Organization. Interactive Brokers LLC provides access to ForecastEx forecast contracts for eligible customers. Interactive Brokers LLC does not make recommendations with respect to any products available on its platform, including those offered by ForecastEx.
Disclosure: Forecast Contracts
Forecast Contracts are only available to eligible clients of Interactive Brokers LLC, Interactive Brokers Hong Kong Limited, and Interactive Brokers Singapore Pte. Ltd.
Disclosure: ForecastEx Market Sentiment
Displayed outcome information is based on current market sentiment from ForecastEx LLC, an affiliate of IB LLC. Current market sentiment for contracts may be viewed at ForecastEx at https://forecasttrader.interactivebrokers.com/en/home.php. Note: Real-time market sentiment updates are only active during exchange open trading hours. Updates to current market sentiment for overnight activity will be reflected at the open on the next trading day. This information is not intended by IBKR as an opinion or likelihood of a potential outcome.
Disclosure: CFTC Regulation 1.71
This is commentary on economic, political and/or market conditions within the meaning of CFTC Regulation 1.71, and is not meant to provide sufficient information upon which to base a decision to enter into a derivatives transaction.


