By: SSGA
Gold Market Recap
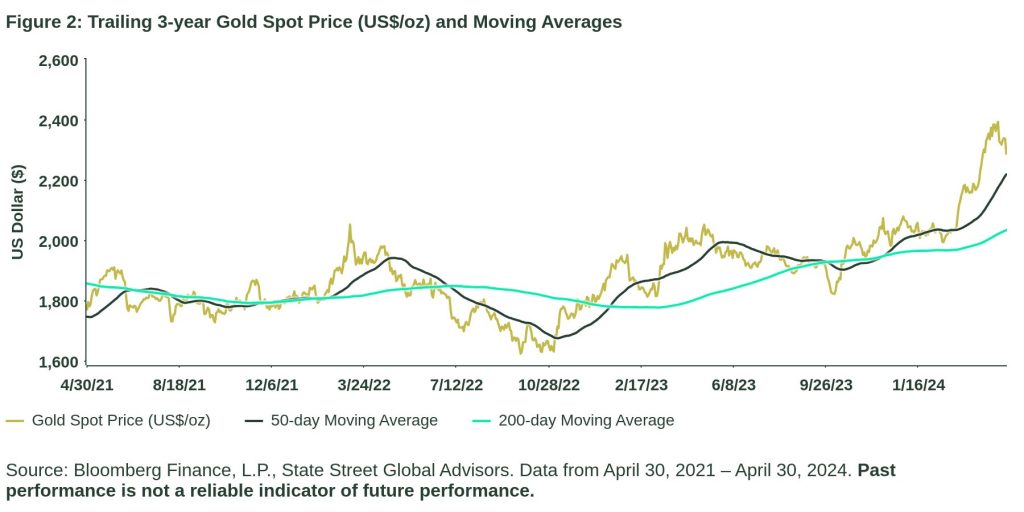
Gold remained resilient throughout April, with the US$ spot price rising 2.53%.1 This was the fifth month of gains, and saw gold reach an all-time high of US$2,392/oz on April 19, 2024, before closing the month slightly lower at $2,292/oz.2 Despite the pullback at the end of the month, gold is still noticeably above its trailing 50-day and 200-day moving average.3 Thanks to another strong month, year-to-date returns are now 10.82%,4 with performance benefiting from robust central bank demand and retail investment from China.
The main headwind for gold in April was a strong US dollar, as every major developed and emerging economy currency, with the exception of the Chinese yuan, was down versus the dollar in April.5 US 2-year yields rose above 5% for the first time since last November but didn’t appear to present significant headwinds. Gold’s spot price rose alongside yields during the month, particularly following the surge in rates in the early part of April on the back of hotter-than-expected CPI.6
This divergence from the typical relationship between gold prices and yields suggests that other factors are influencing gold’s performance, including heightened geopolitical tensions, increased demand for safe-haven assets, and uncertainty in global monetary policy expectations. Gold’s global appeal as a potential hedge against inflation and currency depreciation may have contributed to its resilience, too, despite the relative opportunity cost represented by US 2-year yields.
Gold Performance Drivers
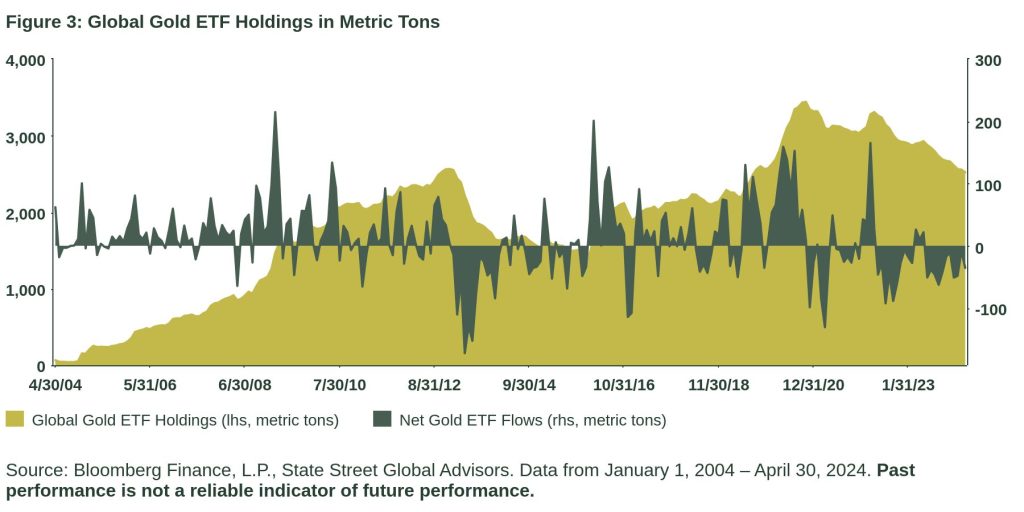
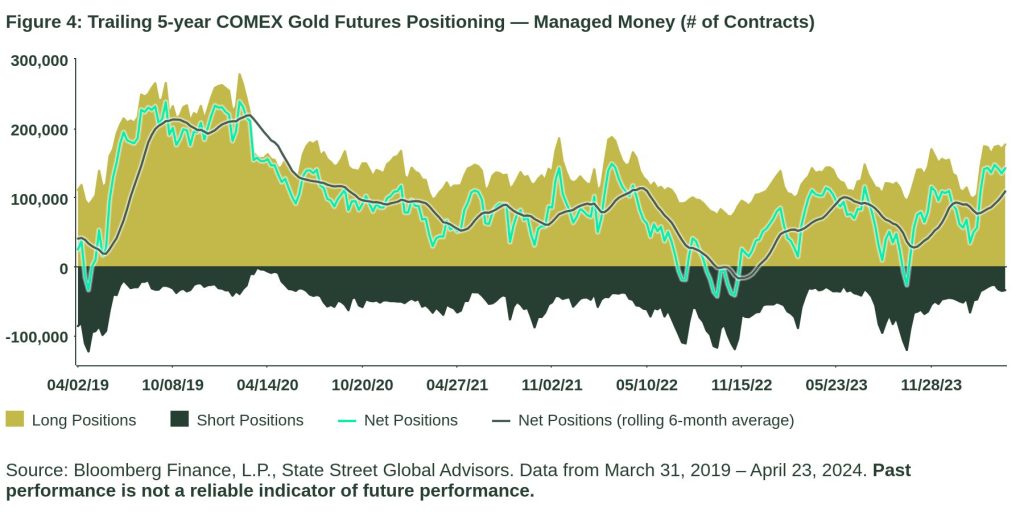
Flows: Global gold ETF holdings fell by 1.4% in April, an estimated 35 metric tons (t). This is the 11th consecutive month of outflows, according to Bloomberg data.7 Net speculative positioning in COMEX gold futures increased to 142,139 contracts, which is significantly higher than the three-year average of 66,559 contracts. The recent extension of long contracts indicates that money managers remain bullish on gold.8
Factors: Following record highs in both March and April, gold experienced a slight pullback to end April just below the most recent high. But strong demand fundamentals suggest that gold prices may have some momentum to appreciate further. ETF investors could seize the opportunity presented by any pullback to re-enter the market.
Fundamentals: Q1 gold demand (excluding OTC demand) slipped 5% year-over-year to 1,102t due to continued ETF outflows. Inclusive of sizeable OTC buying, total gold demand increased 3% year-over-year to 1,238t — the strongest first quarter since 2016.9
Gold Chart of the Month
Figure 1: Healthy Consumer and Central Bank Buying Continues to Support Prices
| Q1 2023 Demand (t) | Q1 2024 Demand (t) | Quarter-on-quarter Change | Year-on-year % Change | |
| Gold demand | 1,163.7 | 1,101.8 | ▼ | -5 |
| Jewelry | 531.0 | 535.0 | ▲ | 1 |
| Technology | 71.2 | 78.6 | ▲ | 10 |
| Investment | 275.3 | 198.6 | ▼ | -28 |
| Total Bar and Coin | 303.9 | 312.3 | ▲ | 3 |
| ETFs and similar products | -28.6 | -113.7 | – | – |
| Central Banks & Other Institutions | 286.2 | 289.7 | ▲ | 1 |
| Daily Average Spot Price Gold ($/oz) | $1,892 | $2,140 | ▲ | 13 |
Source: Metals Focus, Refinitiv GFMS, ICE Benchmark Administration, World Gold Council, and State Street Global Advisors, as of April 30, 2024. Past performance is not a reliable indicator of future performance.
Gold Price Trends
Gold ETF Flows
Gold Futures
This post first appeared on May 8th, 2024 on the State Street Global Advisors’ blog
PHOTO CREDIT: https://www.shutterstock.com/g/macrowildlife
Via SHUTTERSTOCK
Glossary
Gold Spot Price
The price in spot markets for gold. In US dollar terms, spot gold is referred to with the symbol XAU, which refers to the price of one troy ounce of gold in USD terms.
LBMA Gold Price PM Index
Provides the price platform and methodology as well as the overall administration and governance for the LBMA Gold Price.
OTC Markets
Characterized by market participants trading directly with each other. The two counterparties to a trade bilaterally agree a price and have obligations to settle the transaction (exchange of cash for gold) with each other. This form of principal-to-principal gold trading is typically less regulated than trading on an exchange and is how most of the market has functioned historically.
Troy ounce (ozt)
Standard unit of measurement for weighing precious metals such as gold, silver, platinum, and palladium.
US 2-year Yields
The yield received for investing in a US government-issued Treasury security that has a maturity of two years.
US Dollar
The official currency of the United States of America.
Footnotes
1 Bloomberg Finance L.P., State Street Global Advisors. Data as of April 30, 2024.
2 Bloomberg Finance L.P., State Street Global Advisors. Data as of April 30, 2024.
3 Bloomberg Finance L.P., State Street Global Advisors. Data as of April 30, 2024.
4 Bloomberg Finance L.P., State Street Global Advisors. Data as of April 30, 2024.
5 Bloomberg Finance L.P., State Street Global Advisors. Data as of April 30, 2024.
6 Bloomberg Finance L.P., State Street Global Advisors. Data as of April 30, 2024.
7 Bloomberg Finance L.P., State Street Global Advisors. Data as of April 30, 2024.
8 Bloomberg Finance L.P., State Street Global Advisors. Data as of April 23, 2024.
9 World Gold Council: Gold Demand Trends Q1 2024. Data as of April 30, 2024.
Disclosures
Important Risk Information
This communication is not intended to be an investment recommendation or investment advice and should not be relied upon as such.
The views expressed in this material are the views of the SPDR Gold Strategy Team through the period ended April 30, 2024 and are subject to change based on market and other conditions. This document contains certain statements that may be deemed forward looking statements. Please note that any such statements are not guarantees of any future performance and actual results or developments may differ materially from those projected.
The information provided does not constitute investment advice and it should not be relied on as such. It should not be considered a solicitation to buy or an offer to sell a security. It does not take into account any investor’s particular investment objectives, strategies, tax status or investment horizon. You should consult your tax and financial advisor.
The trademarks and service marks referenced herein are the property of their respective owners. Third party data providers make no warranties or representations of any kind relating to the accuracy, completeness or timeliness of the data and have no liability for damages of any kind relating to the use of such data.
The whole or any part of this work may not be reproduced, copied or transmitted or any of its contents disclosed to third parties without SSGA’s express written consent.
Commodities and commodity-index linked securities may be affected by changes in overall market movements, changes in interest rates, and other factors such as weather, disease, embargoes, or political and regulatory developments, as well as trading activity of speculators and arbitrageurs in the underlying commodities.
Investing in commodities entails significant risk and is not appropriate for all investors.
Diversification does not ensure a profit or guarantee against loss.
Past performance is not a reliable indicator of future performance.