

Anqi Dong, CFA, CAIA, Senior Research Strategist
Insurance: A strong growth outlook, attractive valuations, and lower volatility profile suggest quality growth at attractive valuations.
Homebuilders: While potential lower mortgage rates support valuations, the demand increase from millennials likely will strengthen industry fundamentals over the next few years.
Biotech: The combination of R&D-focused small firms driving innovation in medicine and big pharma companies showing increased appetite for M&A deals indicates potential growth opportunities.
The S&P 500® Index extended the rally it began in late October, adding 10.6% gains in Q1 and refreshing all-time highs 22 times.1 Market breadth widened with certain value and cyclical sectors, such as Energy and Financials, outperforming.2 While investors dialed back rate cut expectations amid firmer inflation and strong labor markets, higher yields have hurt bonds more than stocks as earnings and economic outlooks hold.
However, equity valuations have become more stretched. And double-digit expected earnings growth for this year and next seems lofty given a cooling economy and lower inflation. Therefore, we favor industries with attractive valuations that have either strong earnings outlooks supported by solid industry growth trends (Insurance and Homebuilders) or long-term growth potential (Biotech).
Insurance: Quality Exposure with Attractive Valuations
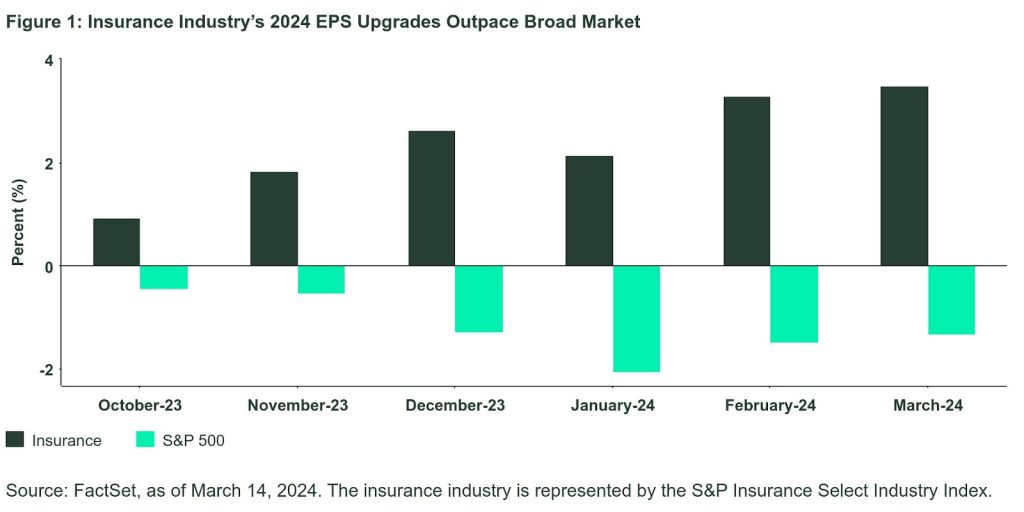
The insurance industry’s strong price momentum continues. After outperforming the broad market in the second half of 2023, insurance has outperformed the S&P 500 and the Financial sector by more than 5% year to date, thanks to continued improvement in industry fundamentals and attractive valuations.3
While the Property & Casualty (P&C) insurers’ profits faced headwinds from significant natural catastrophes and persistent inflation in the first half of last year, positive profit momentum emerged in the second half. P&C insurers’ earned insurance premium increased 9% in the third quarter, outpacing incurred claims by 3%.4 Driven by strong demand and pricing power in personal lines and commercial properties, net written premium — a key indicator of earned premium for the following year — is expected to grow by high single digits in 2024, more than the industry’s long-term average of just under 5%.5 Furthermore, as reinvestment yields remain above average yields on maturing securities, insurers’ investment yields are expected to continue rising in 2024 and 2025, supporting growth in investment income — the second-largest part of their revenues. On the cost side, continued disinflationary trends should keep insurers’ claim costs in check, supporting their margin expansion.
Given these tailwinds, the industry’s earnings outlook has been upgraded since the beginning of the year, compared to downgrades for the broad market (Figure 1). The insurance industry is projected to post 15.9% EPS growth in 2024, compared to 10.7% growth for the S&P 500.6.
Despite its stronger growth outlook, the industry’s forward price-to-earning (P/E) is trading 10% below its 10-year average. Its absolute and relative P/E are in the bottom decile over the past 10 years, pointing to a growth opportunity at attractive valuations.7
The insurance industry has exhibited a market beta of 0.67 and lower volatility than both the broad market and the Financial sector over the past three years,8 when equity markets had big ups and downs driven by rate volatility and economic uncertainty. Still, investors tend to overlook insurance companies because they don’t grab headlines or have glamourous growth stories. Nevertheless, the industry’s strong pricing power and stable cash flows from premiums collection, combined with below-average valuations, make insurance a quality value exposure.
Homebuilders: If You Build It, They Will Come
Thanks to stable mortgage rates, robust housing demand, and multi-decade low existing home inventory, the homebuilder industry has shown great resilience even though the market has dialed back rate cut expectations for this year.
We believe mortgage rates reached the cycle peak last year and likely will continue to drift lower, driven by lower Fed funds rates and the tightening of the yield spreads with Treasuries. While hotter-than-expected inflation sent 10-year Treasury yields up 52 basis points (bps) to 4.4% , 30-year mortgage rates have settled around 7% thanks to tighter spreads between the two.9 After reaching a record wide spread last May, the spread between 30-year mortgage rate and 10-year Treasury yields has tightened, but is still well above the long-term average of 200 bps. Further normalization in spreads will put downward pressure on mortgage rates, improving housing affordability and attracting more buyers to the housing market.
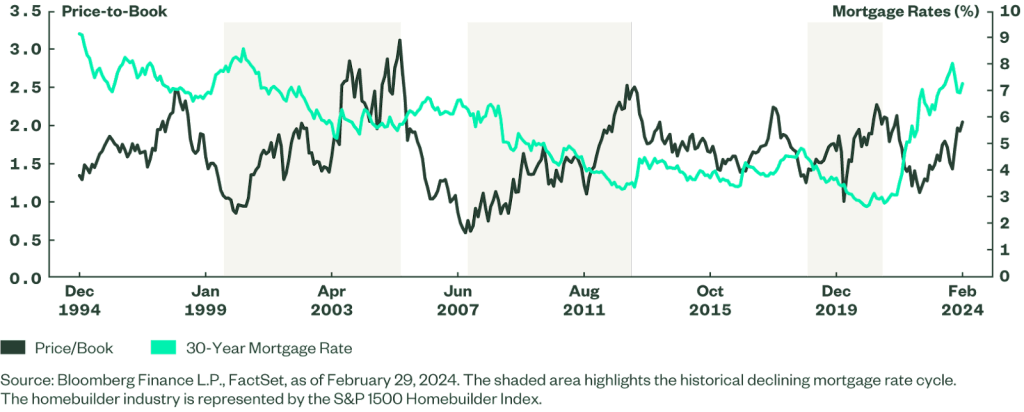
Historically, homebuilder price-to-book (P/B) multiples have tended to expand when mortgage rates trended downward (Figure 2). Admittedly, given more than 40% of gains since the October trough, homebuilder valuations have become less attractive than six months ago when we highlighted this opportunity. Nevertheless, the industry’s current P/B multiples are at least 27% below their historical peaks when mortgage rates were at the cycle low. Since we are still at the early innings of declining mortgage rates and housing demand outpaces supplies, the industry valuations may have further room to expand.
Figure 2: Lower Mortgage Rates Support Homebuilder Valuations
Some investors may question whether lower mortgage rates will increase the existing housing inventory, hurting demand for new construction. Even assuming four rate cuts this year — a very bullish rate outlook at the moment — mortgage rates likely will remain above 5.5% this year. Given that 80% of homeowners locked in a mortgage rate below 5% and 60% locked in below 4%,10 existing housing supply likely will be constrained.
This structural housing shortage will continue supporting housing prices and increasing demand for new construction. Currently, 72 million millennials — now the largest generation group in the US — are near the peak of new household formation and first-time homebuyer age. But the baby boomers — accounting for 38% of total homeowner households — are expected to exit homeownership slowly.11 Therefore, overall US homeownership is expected to increase over the next few years.12 Meanwhile, as housing starts have lagged household formation over the past decade, the gap between the two continues to expand, reaching 2.5 million units in 2023.13
Against this backdrop, homebuilders have shown upbeat earnings sentiment with earnings and sales estimates revised up by 5%,14 as housing starts and permits are on an upward trend. Homebuilder confidence also rose for the fourth consecutive month in March to above the neutral level, supported by strong demand.15
Biotech: Revived M&A Activity and an Innovation Boom
The historic aggressive rate hikes of the past two years have taken a toll on biotech stocks, but the industry’s commitment to innovation based on medical research remains strong. Fifty-five innovative therapies were approved by the FDA in 2023 compared to 37 in 2022 and a 20-year average of 36.16 Tackling challenging health issues that impact millions, these approvals include weight-loss drugs, Alzheimer’s treatments, mRNA-based vaccines to prevent respiratory syncytial virus (RSV), and advanced diagnostic tools for early cancer detection and new treatments.
Smaller, more nimble firms focused on R&D are driving this innovation in medicine; 55% of new drug approvals between 2011 and 2020 were developed by companies with less than $500 million in revenue.17 Meanwhile, the top 25 global pharmaceutical companies are facing an impending deep patent cliff that puts $300 billion of revenue at risk between 2024 and 2028.
Additionally, many of the larger firms’ high revenue products will face drug price negotiation in the coming years under the Inflation Reduction Act (IRA). Given that the IRA allows large-molecule biologics drugs five more years of exemption from mandated drug price negotiation than small-molecule drugs, development of large-molecule biologics drugs could become more valuable for big pharma.
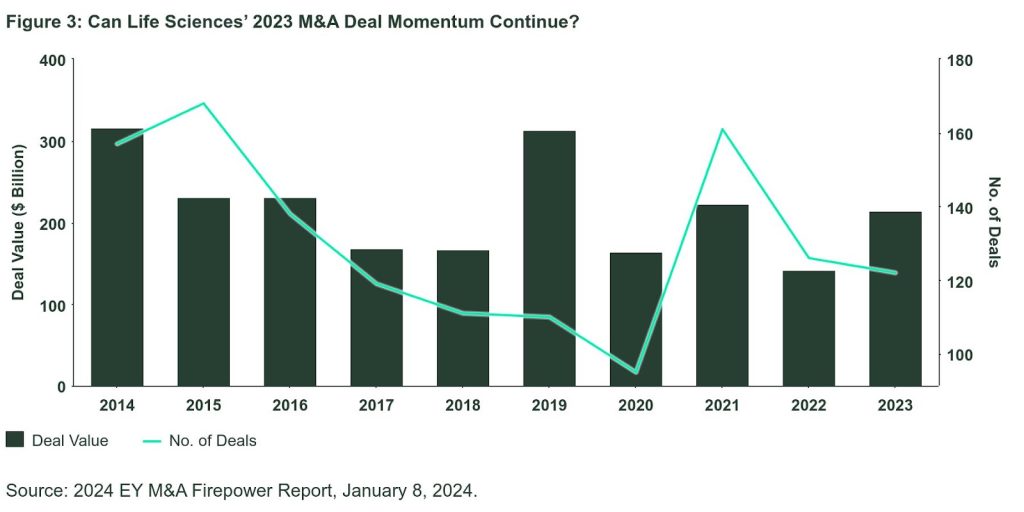
Despite the strong rebound since late October, biotech valuations still appear attractive — close to their lowest level in the past 12 years, barring the recent rate hike cycle. Given the urgency to find new sources of growth, near-record levels of cash on hand,18 and attractive biotech valuations, big pharma has shown increased appetite for M&A deals (Figure 3). Biotech M&A activities picked up in Q4 2023, increasing the total M&A deal value for 2023 by 51% year-over-year and closer to 2021 level, despite there being fewer deals.19 The momentum has continued this year, with a flurry of deals announced in January.20
Although heightened rate uncertainty has weakened the industry’s price momentum, biotech remains at the center of scientific breakthroughs, delivering solutions that transform our lives. The strong M&A appetite of big pharma companies may support biotech valuations.
This post first appeared on April 17th, 2024 on the State Street Global Advisors’ blog
PHOTO CREDIT: https://www.shutterstock.com/g/Piscine
Via SHUTTERSTOCK
Footnotes
1 Bloomberg Finance, L.P., as of March 31, 2024.
2 Bloomberg Finance, L.P., as of March 31, 2024.
3 Bloomberg Finance, L.P., as of March 31, 2024.
4 Swiss Re Institute, January 2024.
5 CFRA Property and Casualty Insurance Survey, Swiss Re Institute, January 2024.
6 FactSet, as of March 18, 2024.
7 FactSet, February 29, 2024.
8 FactSet, February 29, 2024.
9 Bloomberg Finance, L.P., as of April 5, 2024.
10 Redfin, Barclays Research, as of December 2023.
11 Freddie Mac, Economic Housing and Mortgage Market Outlook, February 2024.
12 Freddie Mac, Economic Housing and Mortgage Market Outlook, February 2024.
13 Realtor.com, US Housing Supply Gap Grows in 2023, February 2024.
14 FactSet, as of March 20, 2024.
15 NAHB, as of March 18, 2024.
16 U.S. Food & Drug Administration, February 26, 2024.
17 Bio.News, December 2022.
18 2024 EY M&A Firepower Report, EY, January 8, 2024.
19 The Twists and Turns in Biopharma Dealmaking: 2024 Trends, PharmaExec.com, January 26, 2024.
20 The Twists and Turns in Biopharma Dealmaking: 2024 Trends, PharmaExec.com, January 26, 2024.
Disclosure
Important Risk Disclosure
The views expressed in this material are the views of the SPDR Research and Strategy team through the period ended April 8, 2024, and are subject to change based on market and other conditions. This document contains certain statements that may be deemed forward-looking statements. Please note that any such statements are not guarantees of any future performance and actual results or developments may differ materially from those projected.
This communication is not intended to be an investment recommendation or investment advice and should not be relied upon as such.
All information is from SSGA unless otherwise noted and has been obtained from sources believed to be reliable, but its accuracy is not guaranteed. There is no representation or warranty as to the current accuracy, reliability or completeness of, nor liability for, decisions based on such information and it should not be relied on as such.
Investing involves risk including the risk of loss of principal.
ETFs trade like stocks, are subject to investment risk, fluctuate in market value and may trade at prices above or below the ETFs net asset value. Brokerage commissions and ETF expenses will reduce returns.
The S&P 500® Index is a product of S&P Dow Jones Indices LLC or its affiliates (“S&P DJI”) and have been licensed for use by State Street Global Advisors. S&P®, SPDR®, S&P 500®,US 500 and the 500 are trademarks of Standard & Poor’s Financial Services LLC (“S&P”); Dow Jones® is a registered trademark of Dow Jones Trademark Holdings LLC (“Dow Jones”) and has been licensed for use by S&P Dow Jones Indices; and these trademarks have been licensed for use by S&P DJI and sublicensed for certain purposes by State Street Global Advisors. The fund is not sponsored, endorsed, sold or promoted by S&P DJI, Dow Jones, S&P, their respective affiliates, and none of such parties make any representation regarding the advisability of investing in such product(s) nor do they have any liability for any errors, omissions, or interruptions of these indices.
Equity securities may fluctuate in value and can decline significantly in response to the activities of individual companies and general market and economic conditions.
There can be no assurance that a liquid market will be maintained for ETF shares.
Concentrated investments in a particular sector or industry tend to be more volatile than the overall market and increases risk that events negatively affecting such sectors or industries could reduce returns, potentially causing the value of a Fund’s shares to decrease.
Non-diversified funds that focus on a relatively small number of securities tend to be more volatile than diversified funds and the market as a whole.
Biotechnology Companies Risk: Biotech companies invest heavily in research and development which may not necessarily lead to commercially successful products. These companies are also subject to increased governmental regulation which may delay or inhibit the release of new products. Many biotech companies are dependent upon their ability to use and enforce intellectual property rights and patents. Any impairment of such rights may have adverse financial consequences. Biotech stocks, especially those of smaller, less-seasoned companies, tend to be more volatile than the overall market. Biotech companies can be significantly affected by technological change and obsolescence, product liability lawsuits and consequential high insurance costs.
While the shares of ETFs are tradable on secondary markets, they may not readily trade in all market conditions and may trade at significant discounts in periods of market stress.
When the Fund focuses its investments in a particular industry or sector, financial, economic, business, and other developments affecting issuers in that industry, market, or economic sector will have a greater effect on the Fund than if it had not done so.
Passively managed funds invest by sampling the Index, holding a range of securities that, in the aggregate, approximates the full Index in terms of key risk factors and other characteristics. This may cause the fund to experience tracking errors relative to performance of the Index.
The whole or any part of this work may not be reproduced, copied or transmitted or any of its contents disclosed to third parties without SSGA’s express written consent.
The trademarks and service marks referenced herein are the property of their respective owners. Third party data providers make no warranties or representations of any kind relating to the accuracy, completeness or timeliness of the data and have no liability for damages of any kind relating to the use of such data.
