

By: Kevin Flanagan, Head of Fixed Income Strategy
Remember when inverted Treasury (UST) yield curves were all the rage? Not that long ago, there was a plethora of stories “hitting the tape” about this development, and with it, the conjecture quotient rose regarding when the U.S. economy would enter into a recession.
Well, investors are still waiting for signs of that recession. Certainly, some of the recent economic data that has been released is beginning to show increasing evidence that activity does appear to be slowing. And when you add the tighter lending conditions that are also becoming more readily apparent, you do get the feeling that it has now become not a matter of if, but just when, real GDP will enter into negative territory.
With respect to the yield curve’s predictive value, if you’re keeping track, the two most closely followed measures, the UST 2-Yr/10-Yr and UST 3-Mo/10-yr gauges, went into inverted or negative territory in July and October/November of last year, respectively. So, if history is any guide, the shot clock does seem to be ticking.
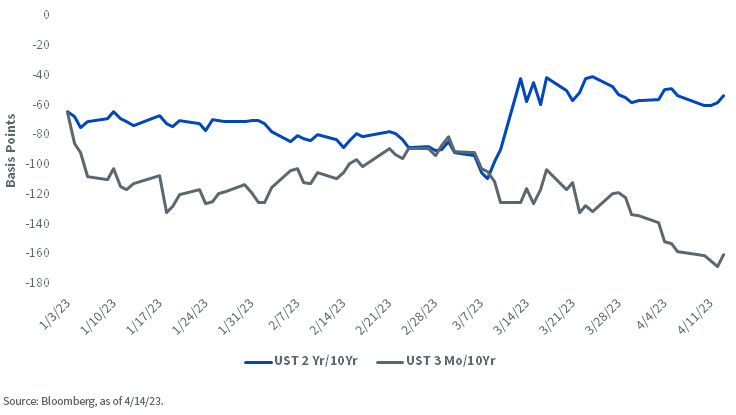
U.S. Treasury Yield Curves
However, in this blog post, I didn’t necessarily want to discuss the prospect of what is perhaps the most widely anticipated recession in my career, but rather, bring the reader up to date on the state of the two aforementioned yield curves.
With respect to the UST 3mo/10yr measure, the inversion has still been gathering steam. To provide some perspective, the negative differential has gone from roughly -50 basis points (bps) to end 2022 to expand to -160 bps as of this writing. Also, compare this to a year ago, when the spread was a positive +200 bps. The more interesting part of this discussion is what has transpired to the UST 2yr/10yr gauge. Yes, it is still firmly in negative territory, but this curve has actually steepened of late. On March 8, pre-Silicon Valley Bank (SVB), the inversion reached its peak of -109 bps, but since then, the negative differential has been essentially cut in half to -53 bps. Meanwhile, for the UST 3mo/10yr, the inversion has increased by about 55 bps.
What’s behind this divergent behavior? Well, obviously, the UST 10-Year aspect of both curves is a constant force, so the answer lies in the different yield activity between the 3-Month t-bill and the UST 2-Year note. For the former, the yield has remained just under 5%, but for the 2-Year, the yield has plunged about 100 bps during the last five weeks or so. While the 3-Month t-bill has been tethered to the Fed Funds trading range, the 2-Year yield has fallen for two key reasons: the changing Fed outlook, where rate cut expectations have increased, and inflows coming in from either a safe haven status or attempts to lock in yields before any Fed reversal.
Conclusion
For fixed income investors, the continued inverted shape of the yield curve plays into the notion that I’d still rather be “late than early” to the duration party.
Originally Posted April 12th, 2023, WisdomTree
PHOTO CREDIT: https://www.shutterstock.com/g/g0d4ather
Via SHUTTERSTOCK
U.S. investors only: Click here to obtain a WisdomTree ETF prospectus which contains investment objectives, risks, charges, expenses, and other information; read and consider carefully before investing.
There are risks involved with investing, including possible loss of principal. Foreign investing involves currency, political and economic risk. Funds focusing on a single country, sector and/or funds that emphasize investments in smaller companies may experience greater price volatility. Investments in emerging markets, currency, fixed income and alternative investments include additional risks. Please see prospectus for discussion of risks.
Past performance is not indicative of future results. This material contains the opinions of the author, which are subject to change, and should not to be considered or interpreted as a recommendation to participate in any particular trading strategy, or deemed to be an offer or sale of any investment product and it should not be relied on as such. There is no guarantee that any strategies discussed will work under all market conditions. This material represents an assessment of the market environment at a specific time and is not intended to be a forecast of future events or a guarantee of future results. This material should not be relied upon as research or investment advice regarding any security in particular. The user of this information assumes the entire risk of any use made of the information provided herein. Neither WisdomTree nor its affiliates, nor Foreside Fund Services, LLC, or its affiliates provide tax or legal advice. Investors seeking tax or legal advice should consult their tax or legal advisor. Unless expressly stated otherwise the opinions, interpretations or findings expressed herein do not necessarily represent the views of WisdomTree or any of its affiliates.
The MSCI information may only be used for your internal use, may not be reproduced or re-disseminated in any form and may not be used as a basis for or component of any financial instruments or products or indexes. None of the MSCI information is intended to constitute investment advice or a recommendation to make (or refrain from making) any kind of investment decision and may not be relied on as such. Historical data and analysis should not be taken as an indication or guarantee of any future performance analysis, forecast or prediction. The MSCI information is provided on an “as is” basis and the user of this information assumes the entire risk of any use made of this information. MSCI, each of its affiliates and each entity involved in compiling, computing or creating any MSCI information (collectively, the “MSCI Parties”) expressly disclaims all warranties. With respect to this information, in no event shall any MSCI Party have any liability for any direct, indirect, special, incidental, punitive, consequential (including loss profits) or any other damages (www.msci.com)
Jonathan Steinberg, Jeremy Schwartz, Rick Harper, Christopher Gannatti, Bradley Krom, Kevin Flanagan, Brendan Loftus, Joseph Tenaglia, Jeff Weniger, Matt Wagner, Alejandro Saltiel, Ryan Krystopowicz, Brian Manby, and Scott Welch are registered representatives of Foreside Fund Services, LLC.
WisdomTree Funds are distributed by Foreside Fund Services, LLC, in the U.S. only.
You cannot invest directly in an index.


