

By:Jose Torres, Interactive Brokers’ Senior Economist
Inflation and the Fed
The rate of overall inflation is slowing against the backdrop of slowing consumption and tighter financial conditions. The Fed’s preferred gauge of inflation, the core PCE, is at 4.9 percent as of August, almost two and a half times the Fed’s 2 percent target. The Fed is expected to continue raising the federal funds rate from its 3.13 percent level in order to dampen inflationary pressures. The market is currently expecting the Fed to raise 75 basis points at the November meeting and another 50 at the December meeting to a rate of 4.38 percent by year-end. Another 25 basis point increase in 2023 will leave the terminal rate at 4.63 percent. In addition, the Fed has increased the pace of their balance sheet reduction program to a monthly cap of $95 billion in September from $47.5 billion in the months prior, further constraining the money supply and financial conditions alike. As the Fed continues to tighten financial conditions, it places downward pressure on the money supply and inflation, upward pressure on short-term interest rates and downward pressure on GDP. The Fed has expressed a strong commitment of keeping rates higher for longer until they see convincing evidence of inflation returning to their 2 percent target, even as economic conditions continue to deteriorate.
Leading economic indicators point to 3rd quarter GDP growth of 0.5%.
Below we will examine what each leading economic indicator, as it is released, portents to our picture of the evolving economic landscape. This is our view at the moment and our projections may be confirmed or we may have to adjust them as different, new information, including freshly released economic indicators are made available.
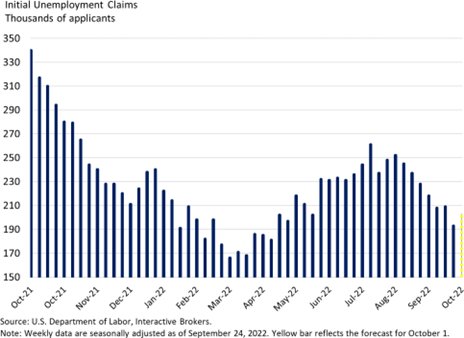
Initial Unemployment Claims
Initial unemployment claims have been volatile in the last few months against the backdrop of labor shortages, negative real wage growth and tighter financial conditions. Weekly claims fell to 166k in mid-March, rose to 261k in mid-July and fell again to 193k in late September. While there’s been anecdotal evidence of hiring freezes and rising layoffs, we’ve also seen companies hoard labor due to difficulties hiring during the pandemic, the current labor shortage and compensation expenses that are rising slower than overall prices. We expect the economic slowdown, tighter credit conditions and higher interest rates to eventually lead to higher unemployment in 2023. Fiscal stimulus has been absent in 2022 unlike 2020 and 2021, constraining consumer spending. Persistent inflation has also pressured consumers and they’ve responded by consuming less, pressuring business revenue. During times of monetary policy tightening and higher interest rates, business revenue tends to slow because goods and services become more expensive to finance, leading to possible layoffs. If initial unemployment claims rise, it points to lower consumption, lower demand, lower inflation, lower long-term interest rates and lower GDP growth. If initial unemployment claims drop significantly, demand will rise, inflation will rise, long-term interest rates will rise and GDP growth will rise. The next release will be on October 6th. It is currently expected to be 203,000, an increase from the previous week’s reading of 193,000. Should the actual number be much lower or higher, we would have to adjust our outlook by slightly raising or lowering our estimate for economic indicators and ultimately our estimate for GDP.
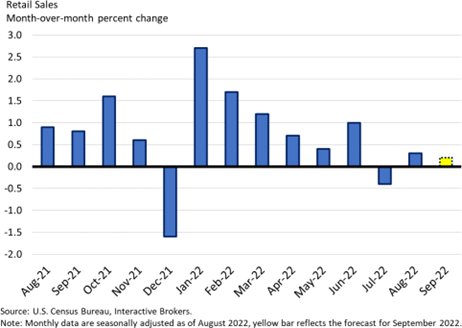
Retail Sales
The rate of retail sales growth is slowing against the backdrop of tighter financial conditions. After growing at a strong rate for most of the past twelve months supported by strong monetary and fiscal stimulus, retail sales have slowed and have contracted when adjusted for inflation in some recent months, implying that consumers are buying less on a volume basis. Expectations of continued slowing is expected as the Fed continues to tighten credit conditions and raise rates, slowing demand. Fiscal stimulus has also been absent in 2022 unlike 2020 and 2021, constraining consumer spending on a relative basis. Persistent inflation has also emerged as a new headwind pressuring consumers and they’ve responded by purchasing less. During times of monetary policy tightening and higher interest rates, consumption tends to slow because goods and services become more expensive to finance. If retail sales continue to slow or contract in certain periods, it points to lower consumption, lower demand, lower inflation, lower long-term interest rates and slower GDP growth. If retail sales growth ramps up again due to monetary policy easing, consumption will rise, demand will rise, inflation will rise, short-term interest rates will fall and GDP growth will rise. The next month’s release will be on October 14th. It is currently expected to be a 0.2% month over month gain, a slower pace from the previous month’s reading of 0.3%, sustaining the downward trend from the past few months. Should the actual number be much lower or higher, we would have to adjust our outlook by slightly raising or lowering our estimate for economic indicators and ultimately our estimate for GDP.
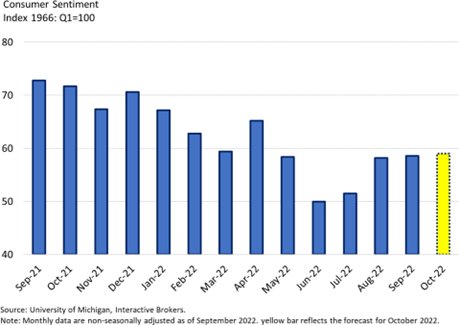
Consumer Sentiment
Consumer sentiment is weakening against the backdrop of tighter financial conditions and high inflation. After remaining at a strong level for most of the past twelve months supported by strong monetary and fiscal stimulus, consumer sentiment has slowed significantly. Expectations of continued slowing is expected as the Fed continues to tighten credit conditions and raise rates, slowing demand. Fiscal stimulus has also been absent in 2022 unlike 2020 and 2021, constraining consumer sentiment on a relative basis. Persistent inflation has also emerged as a new headwind pressuring consumers and they’ve responded by purchasing less. During times of monetary policy tightening and higher interest rates, sentiment tends to weaken because goods and services become more expensive to finance. If consumer sentiment continues to weaken, it points to lower consumption, lower demand, lower inflation, lower long-term interest rates and lower GDP growth. If consumer sentiment ramps up again due to monetary policy easing, consumption will rise, demand will rise, inflation will rise, short-term interest rates will fall and GDP growth will rise. The next month’s release will be on October 14th. It is currently expected to be 59, a slight increase from the previous month’s reading of 58.6, sustaining the downward trend from the past few months. Should the actual number be much lower or higher, we would have to adjust our outlook by slightly raising or lowering our estimate for economic indicators and ultimately our estimate for GDP.
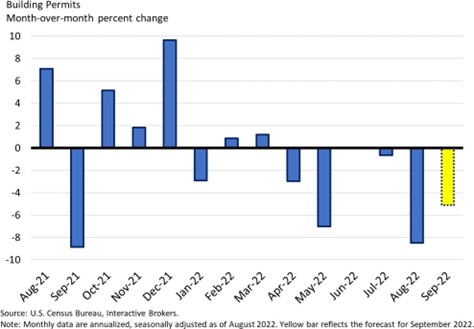
Building Permits
Building permits are falling against the backdrop of tighter financial conditions and a lack of homebuyers. After growing at a strong level for most of the past twelve months, supported by strong monetary policy stimulus and an increased demand for housing due to the pandemic, building permits have slowed and are now in contraction territory. Expectations of continued slowing is expected as the Fed continues to tighten credit conditions and raise rates, slowing demand in this capital intensive, economically cyclical, interest rate sensitive industry. Significant home price growth has pressured affordability to near its worst level in history, leading to significant contractions in mortgage applications. During times of monetary policy tightening and higher interest rates, building tends to slow because real estate becomes much more expensive to finance. If building permits continue to contract, it points to lower consumption, lower demand, lower inflation, lower long-term interest rates and lower GDP growth. If building permit growth ramps up again due to monetary policy easing, demand will rise, inflation will rise, short-term interest rates will fall and GDP growth will rise. The next month’s release will be on October 19th. It is currently expected to be a -5.1% month over month decline, a slower rate of decline from the previous month’s reading of -8.5%, sustaining the downward trend from the past few months. Should the actual number be much lower or higher, we would have to adjust our outlook by slightly raising or lowering our estimate for economic indicators and ultimately our estimate for GDP.
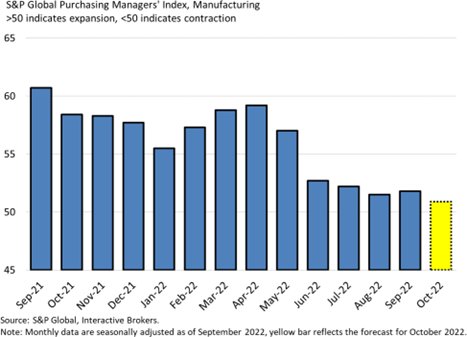
PMI-Manufacturing
Manufacturing activity is slowing against the backdrop of tighter financial conditions and slowing consumption. After expanding at a strong level for much of the past twelve months, supported by strong monetary and fiscal policy stimulus and an increased demand for manufactured goods rather than services due to the pandemic, manufacturing activity has slowed significantly and is now near contraction territory. New orders have recently hovered in and out of contraction territory, historically a leading indicator of not just the manufacturing sector, but of the entire economy. Expectations of continued slowing is expected as the Fed continues to tighten credit conditions and raise rates, slowing demand in this capital intensive, economically cyclical, interest rate sensitive industry. During times of monetary policy tightening and higher interest rates, manufacturing tends to slow because manufactured, durable goods like furniture, automobiles, airplanes and factory equipment become much more expensive to finance. If manufacturing activity continues to slow, it points to lower consumption, lower demand, lower inflation, lower long-term interest rates and lower GDP growth. If manufacturing activity ramps up again due to monetary policy easing, demand will rise, inflation will rise, short-term interest rates will fall and GDP growth will rise. The next month’s release will be on October 24th. It is currently expected to be 50.9, a decrease from the previous month’s reading of 51.8, sustaining the downward trend from the past few months and nearing contraction territory. Should the actual number be much lower or higher, we would have to adjust our outlook by slightly raising or lowering our estimate for economic indicators and ultimately our estimate for GDP.
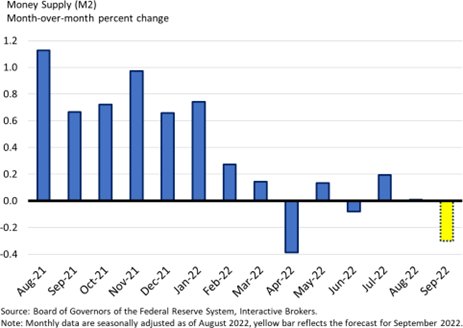
Money Supply
The rate of inflation and economic growth are weakening against the backdrop of a contracting money supply. The money supply, inflation and economic growth shift a great deal due to the Fed’s monetary policy. After increasing drastically since the emergence of COVID-19 to help businesses and households cope with pandemic disruptions, the money supply is currently contracting from its April 2022 peak. The Fed has pivoted from an accommodative monetary policy stance towards a restrictive one because they recognize that money supply growth during years 2020 and 2021 contributed to today’s high inflation. In addition, reduced fiscal spending from Congress due to similar concerns about inflation also limit money supply growth. As credit becomes less available, the Fed continues to raise rates and reduce their bond holdings, and Congress doesn’t spend as much on a relative basis, the money supply is expected to continue contracting. The more persistent inflation ends up being, the longer the Fed will have to maintain a restrictive position and therefore, place a cap on money supply growth. At this point in time, trends of money supply contraction are speeding up because the Fed has a long road of tightening ahead in order to achieve their 2 percent inflation target. The Fed has embarked on an aggressive rate hiking campaign and has increased the pace of balance sheet reduction to a monthly cap of $95 billion in September from $47.5 billion in the months prior, further hampering money supply growth. If money supply growth ramps up again due to monetary policy easing, consumption will rise, demand will rise, inflation will rise, short-term interest rates will fall and GDP growth will rise. If the money supply continues to contract, consumption will decline, demand will decline, inflation will decline, short-term interest rates will rise and GDP growth will slow. The next month’s release will be on October 25th. It is currently expected to be a -0.3% month over month decline, a decrease from the previous month’s unchanged reading, maintaining the downward trend from the past few months. Should the actual number be much lower or higher, we would have to adjust our outlook by slightly raising or lowering our estimate for economic indicators and ultimately our estimate for GDP.
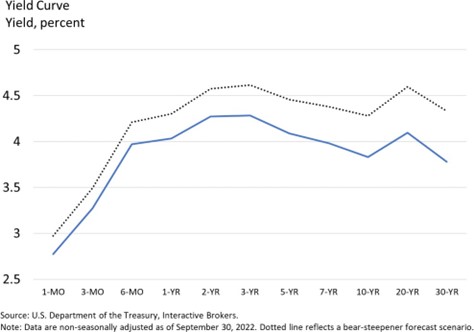
Yield Curve
The yield curve is severely inverted against the backdrop of tighter financial conditions and weak economic prospects. As the 2-year yield rose much faster than the 10-year since January, a bear-flattening move from a much steeper level over the past twelve months, the yield curve is now in deep inversion territory (- 44 bps), signaling continued economic contraction ahead. The money supply increase led to a rise in inflation which compelled the Fed to raise short-term rates significantly. The longer end of the curve, the 10-year maturity, didn’t rise as fast because longer term economic growth and/or inflation isn’t expected to rise as strongly as short-term rates did. The yield curve inversion is telling us that there’s little chance the U.S. economy can handle the monetary policy tightening that’s in the pipeline without a recession. In this case a bull-flattener, where the 2-year would fall slower than the 10-year would be desirable to signal future economic growth but that would require inflation and inflation expectations to come down further, which will likely occur towards the end of Fed tightening. Although inflation expectations are falling, we believe inflation will prove stickier and more resilient than the market thinks. Against the backdrop of accelerating core inflation and a very tight labor market, the expectation in the coming months is to see a bear-steepener where the 10 year rises faster than the 2-year due to an increase in inflation expectations. The main drivers of higher inflation in the medium to long-term are the shift from globalization towards regionalization, geopolitical tensions, relative inefficiencies regarding supply chains and the commodity complex, continued deficit spending and labor shortages. If the yield curve remains severely inverted, it points to lower consumption, lower demand, lower inflation, lower long-term interest rates and lower GDP growth. If the yield curve steepens again due to monetary policy easing, demand will rise, inflation will rise, short-term interest rates will fall and GDP growth will rise. The yield curve inversion (2s, 10s) has predicted the last 6 out of 6 recessions.
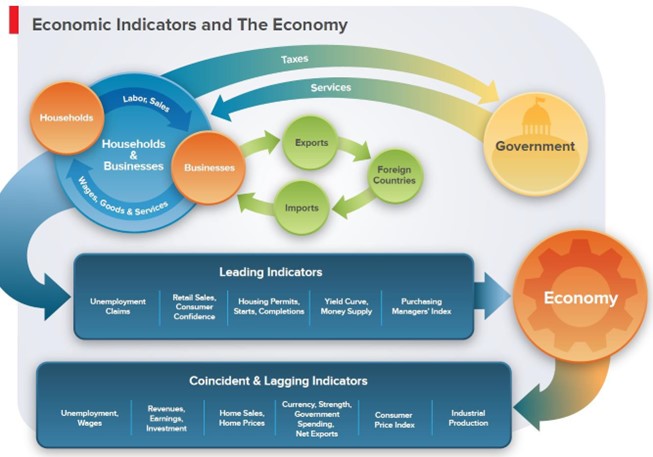
Economic Indicators & The Economy
Below is a picture showing how leading, coincident and lagging economic indicators reflect household, business and government activity. Leading indicators provide early signals of future economic health while coincident and lagging indicators confirm the economic trend in later periods.
Source: Interactive Brokers
Content: Jose Tores – Design: Lucas Deaver
Originally Posted October 3rd 2022, IBKR Traders’ Insight Blog
PHOTO CREDIT: https://www.shutterstock.com/g/StarWarat
Via SHUTTERSTOCK
DISCLOSURE: INTERACTIVE BROKERS
The analysis in this material is provided for information only and is not and should not be construed as an offer to sell or the solicitation of an offer to buy any security. To the extent that this material discusses general market activity, industry or sector trends or other broad-based economic or political conditions, it should not be construed as research or investment advice. To the extent that it includes references to specific securities, commodities, currencies, or other instruments, those references do not constitute a recommendation by IBKR to buy, sell or hold such investments. This material does not and is not intended to take into account the particular financial conditions, investment objectives or requirements of individual customers. Before acting on this material, you should consider whether it is suitable for your particular circumstances and, as necessary, seek professional advice.
The views and opinions expressed herein are those of the author and do not necessarily reflect the views of Interactive Brokers LLC, its affiliates, or its employees.
Any trading symbols displayed are for illustrative purposes only and are not intended to portray recommendations.
In accordance with EU regulation: The statements in this document shall not be considered as an objective or independent explanation of the matters. Please note that this document (a) has not been prepared in accordance with legal requirements designed to promote the independence of investment research, and (b) is not subject to any prohibition on dealing ahead of the dissemination or publication of investment research.


