

By: Steve Sosnick, Chief Strategist at Interactive Brokers
I realize that this is outside our usual wheelhouse of equities, options, volatility and the like, but today’s topic is one that represents the largest single asset class in most family’s portfolios – their home. I saw a chart this morning that showed the steep rise in the median home price in the United States, with the implication that it was unsustainable. The chart was similar to this one:
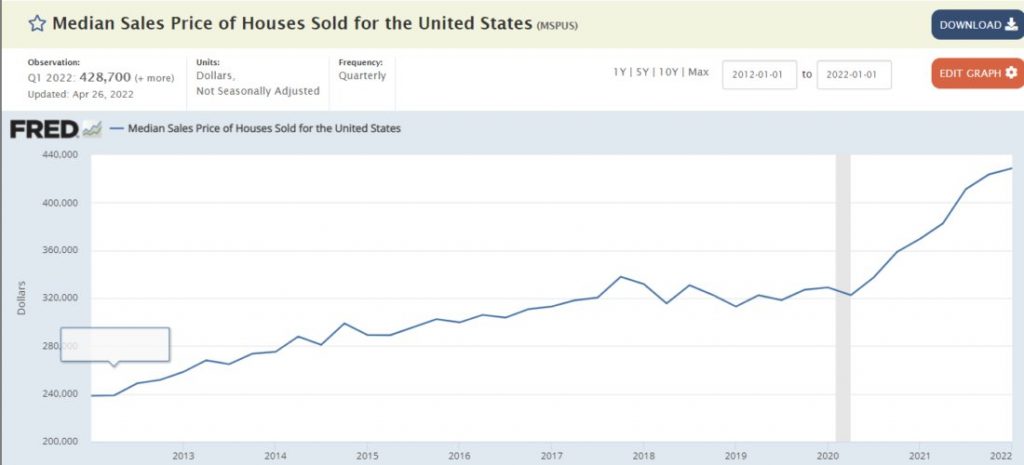
Source: St. Louis Federal Reserve
Indeed, if we see an asset rising at a fairly modest pace that then suddenly increases the pace of its ascent, it is quite sensible to think that the new pace is unsustainable. But it is important to keep in mind that the rising housing prices were accompanied by a similarly stunning drop in mortgage rates – until very recently:
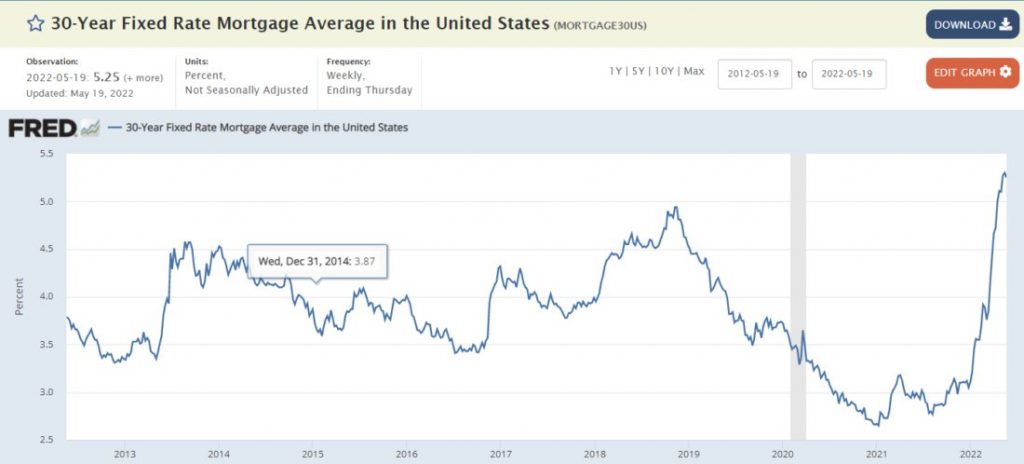
Source: St. Louis Federal Reserve
It occurred to me that the key factor facing potential homeowners is affordability, a function of a house’s price and the monthly mortgage payment that one must make. It is clear that the combination of sharply rising home prices alongside sharply rising mortgage rates bodes dismally for housing affordability, as the following graph shows:
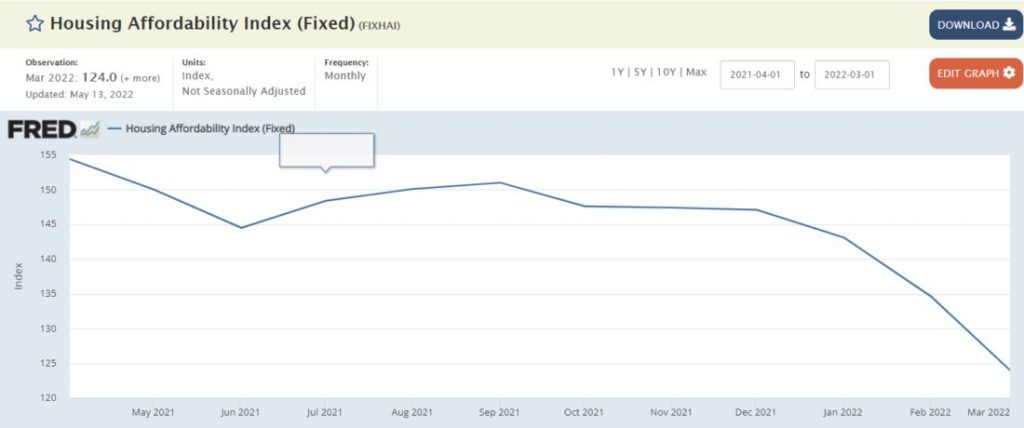
Source: St. Louis Federal Reserve
Unfortunately, the Fed’s data for this index only goes back for a year. There is a prior series, but it is discontinued and discontinuous. So, I decided to create my own affordability index using Fed data. I took the quarterly median home price from the top series, then used the 30 year mortgage rate from the second series. The mortgage data is weekly, so I used the last data point from the quarter in question. I then plugged that data into Bankrate’s mortgage calculator assuming a 10% down payment. Here is what we get:
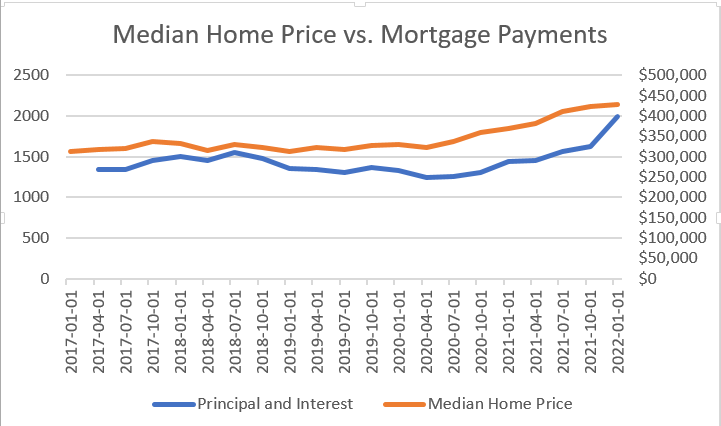
Sources: St. Louis Federal Reserve, Bankrate, Interactive Brokers
We see that the average required mortgage payment decreased through much of 2018-2020, and that payments didn’t rise above their prior peak until late in 2021. The real problem has arisen in the past three quarters. The payment required to buy the median house with the median mortgage has risen by about 27% – from $1562 in the 3rd quarter of 2021 to $1994 in the 1st quarter of 2022.
A 27% rise in almost any out-of-pocket cost is unlikely to be sustainable. Real wages have increased, but at nowhere near that pace. As the Federal Reserve continues to raise rates, it seems unimaginable that housing prices can maintain their current levels – let alone rise.
I’ll be the first to admit that these are crude calculations and housing economics is a complex topic. But if you’re wondering how Fed rate hikes can be transmitted through the economy to help inflation, housing affordability is one. The problem is that it is a very unpleasant method for many.
This post first appeared on May 25th, 2022 on the Traders’ Insight Blog
PHOTO CREDIT: https://www.shutterstock.com/g/k_nopparat
Via SHUTTERSTOCK
DISCLOSURE: INTERACTIVE BROKERS
The analysis in this material is provided for information only and is not and should not be construed as an offer to sell or the solicitation of an offer to buy any security. To the extent that this material discusses general market activity, industry or sector trends or other broad-based economic or political conditions, it should not be construed as research or investment advice. To the extent that it includes references to specific securities, commodities, currencies, or other instruments, those references do not constitute a recommendation by IBKR to buy, sell or hold such investments. This material does not and is not intended to take into account the particular financial conditions, investment objectives or requirements of individual customers. Before acting on this material, you should consider whether it is suitable for your particular circumstances and, as necessary, seek professional advice.
The views and opinions expressed herein are those of the author and do not necessarily reflect the views of Interactive Brokers LLC, its affiliates, or its employees.
Any trading symbols displayed are for illustrative purposes only and are not intended to portray recommendations.
In accordance with EU regulation: The statements in this document shall not be considered as an objective or independent explanation of the matters. Please note that this document (a) has not been prepared in accordance with legal requirements designed to promote the independence of investment research, and (b) is not subject to any prohibition on dealing ahead of the dissemination or publication of investment research.


