

By Mark Barnes, PhD, head of investment research (Americas), and Christine Haggerty, research & analytics
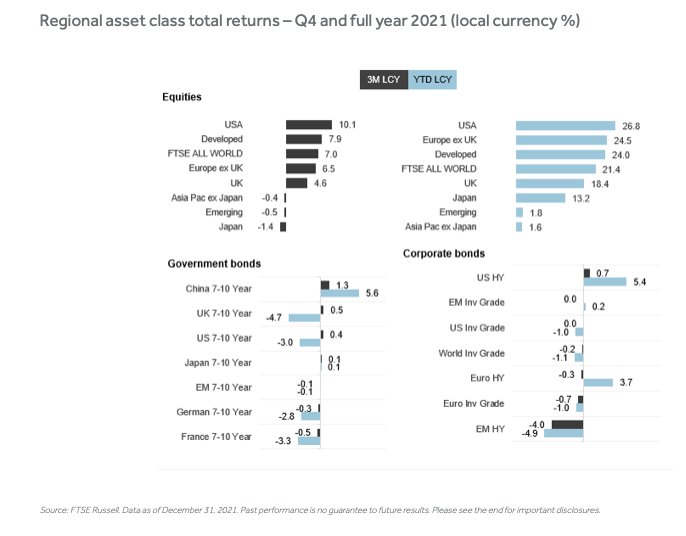
It was a banner year for risk assets. Despite the relentless pandemic overhang and several risk-off stumbles, most equity markets tallied double-digit gains in 2021, and cyclically sensitive stocks strongly outpaced more economically defensive ones.
Oil and other commodity prices surged. High-yield credit posted decent mid-single-digit gains in the US and Eurozone.
So-called “safe” assets had a rougher time. Government and investment-grade corporate bonds and gold generally ended the year flat or lower.
Large-Caps
But there were some notable quirks in this tilt to risk. Large-cap stocks generally outperformed their more erratic smaller-cap peers, particularly in the US.
Stocks and high-yield bonds in emerging markets significantly underperformed. And, the US dollar soared versus most of its developed and emerging-market counterparts, in contrast to its traditional role as the go-to haven currency.
Winners
The hands-down winners of the 2021 reopening race were equity markets in northern Europe (led by the Netherlands and Sweden, up 38.4% and 34.2%, respectively), Canada (up 28.6%) and US stocks (led by the Russell 1000).
The latter index amassed a whopping 11-point lead over non-US stocks in 2021, while stocks elsewhere trailed non-local peers, particularly in Asia Pacific ex Japan and emerging markets.
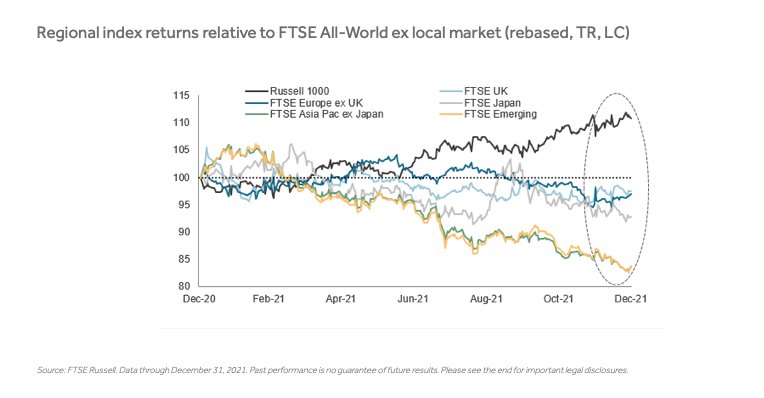
The Russell 1000’s global leadership in 2021 was largely an upshot of its outsized exposure to leviathan tech stocks, which outperformed (rising 31% globally) as investors continued to gravitate to companies with reliable growth fundamentals, particularly as the global economic outlook grew hazier later in the year.
The prevailing low-rate environment also benefited growth stocks, as low or falling yields enhance their future discounted cash flows.
Big Tech
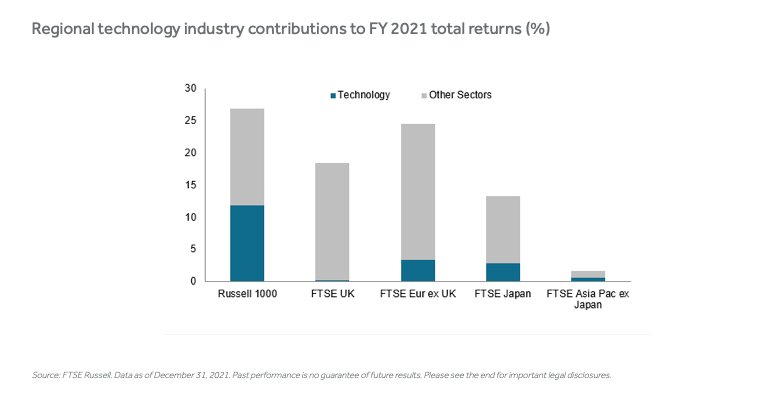
Technology, which makes up 31% of the Russell 1000 vs 14% for the non-US index, single-handedly accounted for 11.8 percentage points (or 45%) of the large-cap index’s total returns, dwarfing the industry’s contributions in other developed markets.
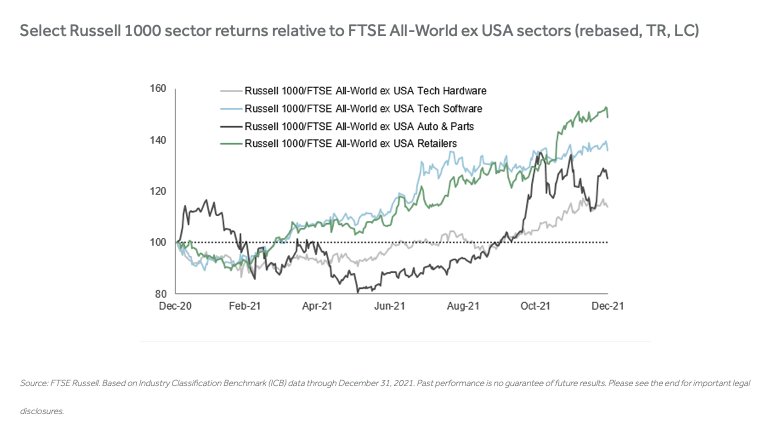
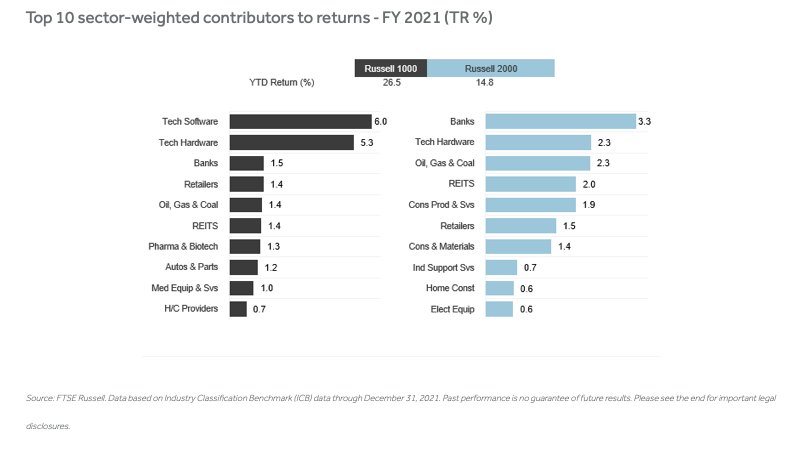
As the time series below illustrates, the outperformance of large-cap technology and consumer discretionary industry groups has been a steadfast driver of the Russell 1000 performance edge this year, with Big Auto and retailers lending a helping hand to tech hardware and software stocks over the past several months.
Big Pharma
Many of the same sector exposures also fueled the Russell 1000’s outsized lead over its small-cap counterpart last year.
Once again, contributions from mega-cap tech hardware and software stocks explain the lion’s share of the difference. Big Auto also helped.
But another major boost came from Big Pharma and medical equipment suppliers, which ranked among the Russell 2000’s worst performers.
This post first appeared on January 6 on the FTSE-Russell blog.
Photo Credit: thenails via Flickr Creative Commons
DISCLOSURE
All information is provided for information purposes only. All information and data contained in this publication is obtained by the LSE Group, from sources believed by it to be accurate and reliable. Because of the possibility of human and mechanical error as well as other factors, however, such information and data is provided “as is” without warranty of any kind. No member of the LSE Group nor their respective directors, officers, employees, partners or licensors make any claim, prediction, warranty or representation whatsoever, expressly or impliedly, either as to the accuracy, timeliness, completeness, merchantability of any information or of results to be obtained from the use of FTSE Russell products, including but not limited to indexes, data and analytics, or the fitness or suitability of the FTSE Russell products for any particular purpose to which they might be put.
Any representation of historical data accessible through FTSE Russell products is provided for information purposes only and is not a reliable indicator of future performance. FTSE All-World index series is a stock market index that covers over 3,100 companies in 47 countries. Other FTSE indexes are designed for exposure to individual countries and regions such as the UK, Japan, Asia and Europe. Other FTSE indexes are focused on sectors and industries. Investors can’t invest directly in indexes.
The Russell 1000 Index is a stock market index that tracks the highest-ranking 1,000 stocks in the Russell 3000 Index, which represent about 90% of the total market capitalization of that index.
No responsibility or liability can be accepted by any member of the LSE Group nor their respective directors, officers, employees, partners or licensors for (a) any loss or damage in whole or in part caused by, resulting from, or relating to any error (negligent or otherwise) or other circumstance involved in procuring, collecting, compiling, interpreting, analysing, editing, transcribing, transmitting, communicating or delivering any such information or data or from use of this document or links to this document or (b) any direct, indirect, special, consequential or incidental damages whatsoever, even if any member of the LSE Group is advised in advance of the possibility of such damages, resulting from the use of, or inability to use, such information.

