By Michael Hampden-Turner, director, fixed Income and multi-asset applied research
2021 saw inflation arrive at the front door. With economic activity picking up again, stimuli in full force and global supply chains disrupted from the pandemic, investors are realizing that our visitor might be here for a while.
The question now is: how easy is it going to be to edge the unwelcome guest out the door, and what does it mean for asset allocation?
Central bank policy makers appear to have a higher tolerance for inflation than in previous cycles, even more so because of QE. They are taking their time as Covid has created a low base from which a jump in inflation is inevitable.
Supply Chains
Equally, economic support measures are being gradually withdrawn, which complicates the analysis. Supply chain disruption and shortages of everything, from HGV drivers to semiconductors, and an uneven pandemic exit between countries, point to a lengthy period of artificial and temporary inflation.
However, there is a risk of being too complacent─ once inflation expectations become engrained they can be persistent. All this means, in the words of the Fed, it is “very difficult to say” how transitory the current surge in inflation is.
While this is unhelpful in answering our question, it does suggest central banks will play a long game in: (a) unwinding QE; (b) raising rates; and (c) remain nervous about growth.
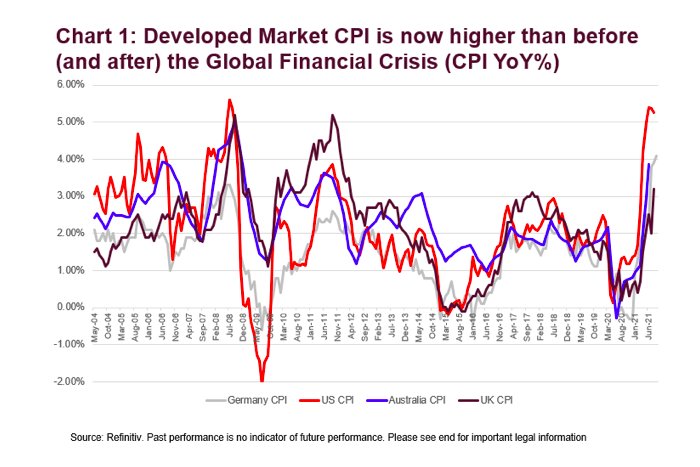
Global CPI
Coming back to the question of how bad inflation is right now, global CPI is topping the high-water mark achieved pre and post the 2008 Global Financial Crisis.
The only time it was consistently higher than now was in the 80s, when rates were in double digits in many economies. Pandemic policy responses have been highly correlated everywhere, so has been inflation outturn. Chart 1 illustrates this increase in correlation.
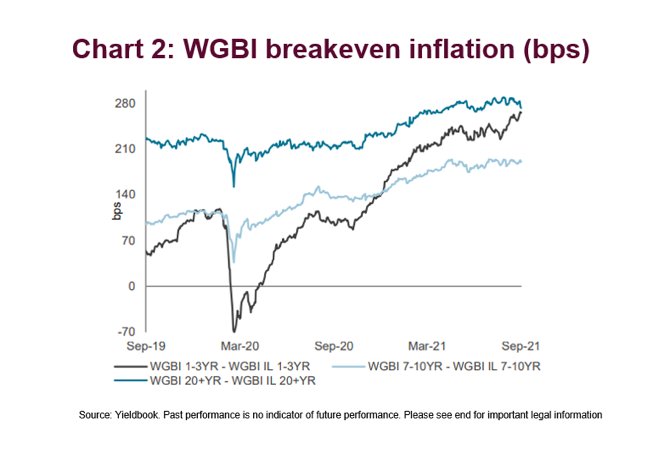
What is market pricing in terms of the quantum and duration of inflation in this cycle?
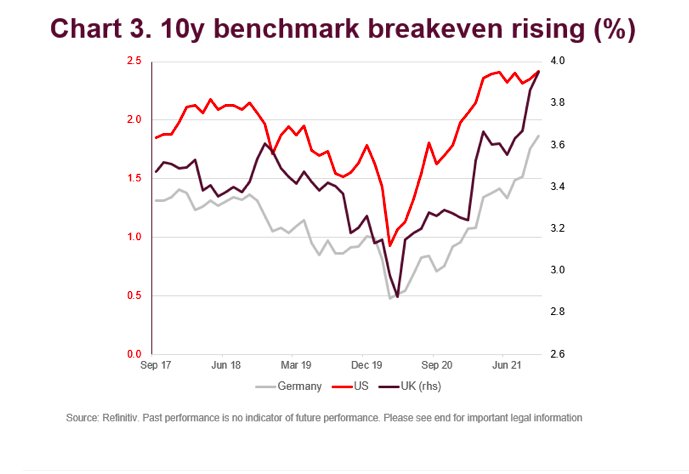
Breakeven inflation rates help us to answer this question. For instance, UK 10-year gilt nominal yields minus UK 10-year inflation-linked gilt yields gives us a 10-year ‘breakeven’ of 3.95% (RPI rather than CPI).
This implies an expected average inflation rate over that time of 3.95% if bonds are priced at risk-neutral fair value (right hand side of chart 3). Breakevens across developed countries (DM) are already near, or pressing past central bank target levels (2% in most DMs) and historical averages, even before Covid measures are removed.
Inflation-Linked Bonds
It is worth adding a note of caution when looking at breakevens. There is a massive mismatch between the supply of inflation linked bonds and the demand for them. Governments, and a few utilities, are the only suppliers of inflation products and demand from pension funds and others tends to outstrip that supply, even in swap markets.
Inflation-linked bonds are also not typically a liquid product, which may mean that high breakevens are just a reflection of a surge in demand caused by the growing dominance of inflation as an ‘investment theme’.
Therefore, what does this tell us about interest rates and bond yields? Looking at breakeven inflation and inflation outturns suggests that central banks should be hiking rates to stem inflation and yet they remain cautious for reasons outlined earlier.
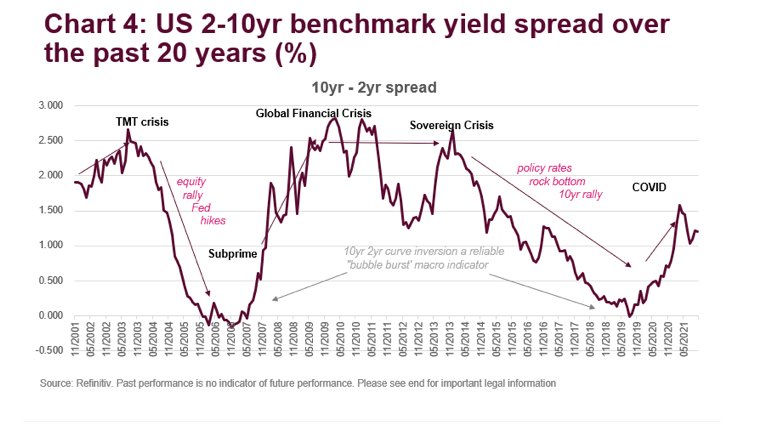
Tapering Risk
With billions of QE still to be unwound, huge uncertainties about inflation and economic growth prospects, ‘term premium’ should be higher than the near record lows set in 2019.
These considerations have been a driving force for curve steepening across DM rates markets and seem likely to remain so, well into 2022. However, the global economic recovery is likely to be marred with setbacks and will see different geographies moving at different paces.
Historically, the US has been a first mover in recovery scenarios and the 2-10yr curve below illustrates how this steepening is already well underway as investors attempt to get ahead of economic fundamentals.
Outlook
If inflation is here for a while, what does it mean for investors?
If central banks decide to unwind QE by selling their long-dated government bonds (rather than letting them mature) as a policy tool to fight inflation, then this sector would be a rather unappealing area to be positioned in.
While a steepening curve will mean more attractive rates in the longer term, it is unappealing for fixed income investors today. So, what are investors doing in response?
To read this post in its entirety, click here and visit the FTSE-Russell blog.
Photo Credit: Pictures of Money via Flickr Creative Commons
Footnotes
[1] Morningstar Inc., data as of December 31, 2020, Worldwide OE, MM & ETF ex FoF ex Feeder, Exclude Obsolete Funds, Global Broad Category Group: Money Market.
DISCLOSURE
All information is provided for information purposes only. All information and data contained in this publication is obtained by the LSE Group, from sources believed by it to be accurate and reliable. Because of the possibility of human and mechanical error as well as other factors, however, such information and data is provided “as is” without warranty of any kind. No member of the LSE Group nor their respective directors, officers, employees, partners or licensors make any claim, prediction, warranty or representation whatsoever, expressly or impliedly, either as to the accuracy, timeliness, completeness, merchantability of any information or of results to be obtained from the use of FTSE Russell products, including but not limited to indexes, data and analytics, or the fitness or suitability of the FTSE Russell products for any particular purpose to which they might be put. Any representation of historical data accessible through FTSE Russell products is provided for information purposes only and is not a reliable indicator of future performance.
No responsibility or liability can be accepted by any member of the LSE Group nor their respective directors, officers, employees, partners or licensors for (a) any loss or damage in whole or in part caused by, resulting from, or relating to any error (negligent or otherwise) or other circumstance involved in procuring, collecting, compiling, interpreting, analysing, editing, transcribing, transmitting, communicating or delivering any such information or data or from use of this document or links to this document or (b) any direct, indirect, special, consequential or incidental damages whatsoever, even if any member of the LSE Group is advised in advance of the possibility of such damages, resulting from the use of, or inability to use, such information.
Past performance is no guarantee of future results. Charts and graphs are provided for illustrative purposes only. Index returns shown may not represent the results of the actual trading of investable assets. Certain returns shown may reflect back-tested performance. All performance presented prior to the index inception date is back-tested performance.
Back-tested performance is not actual performance, but is hypothetical. The back-test calculations are based on the same methodology that was in effect when the index was officially launched. However, back- tested data may reflect the application of the index methodology with the benefit of hindsight, and the historic calculations of an index may change from month to month based on revisions to the underlying economic data used in the calculation of the index.
This publication may contain forward-looking assessments. These are based upon a number of assumptions concerning future conditions that ultimately may prove to be inaccurate. Such forward-looking assessments are subject to risks and uncertainties and may be affected by various factors that may cause actual results to differ materially.