By Philip Lawlor, head of Global Investment Research, FTSE Russell
The accelerated vaccine rollout means we face a significant inflection point for economies and markets. Market participants are trying to incorporate this into portfolio construction and asset allocation, perhaps aware that, historically, economists and analysts have had a tendency to underreact to inflection points.
The economist JM Keynes was also an enormously successful investment manager. His advice was “to devote our intelligence to anticipating what average opinion expects the average opinion to be.” In other words: focus on what the consensus forecast is, considering what is discounted, and think about how that consensus view could gravitate over time.
The consensus, then, is a post-COVID V-shaped recovery, with faith in the persistence of central banks’ unconventional policy measures, and their continued support for financial repression, even in the face of signs of increasing inflation.
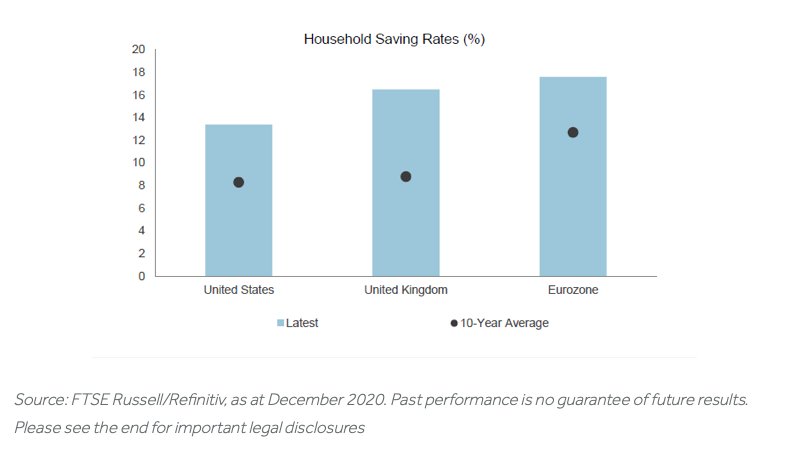
A reopened economy and consumers with higher-than-average savings Chart 1 (below) is just one factor in the consensus that inflation will increase. Bond vigilantes are showing concern that the Fed may be behind the inflation curve, which could lead to rates raised too early, and the recovery stalling.
But there are lots of ways inflation can be delivered. Demand pull inflation occurs when excess demand growth exceeds growth in potential output – but there remains huge excess capacity in the US economy.
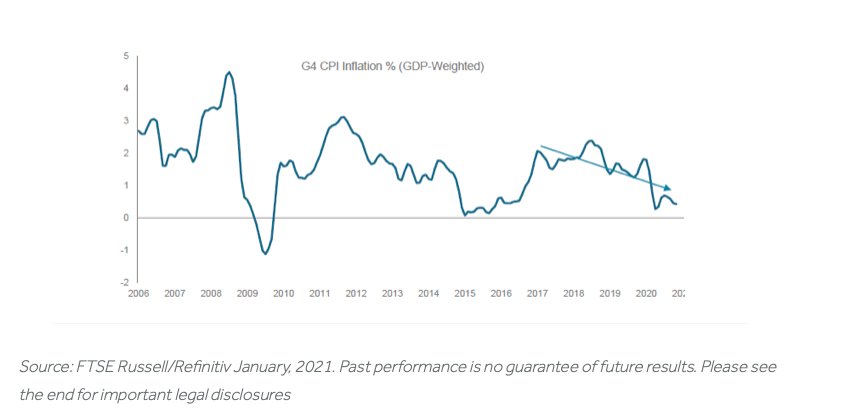
Monetarists remain concerned about the impact of QE and other unconventional policy measures, but Chart 2 (below) shows the task for central banks since the GFC has been getting inflation up to target, rather than keeping it below.
Cost push inflation – where increased demand meets supply and capacity restrictions, causing a surge in input costs, is exercising markets the most with breakeven inflation above 2%.
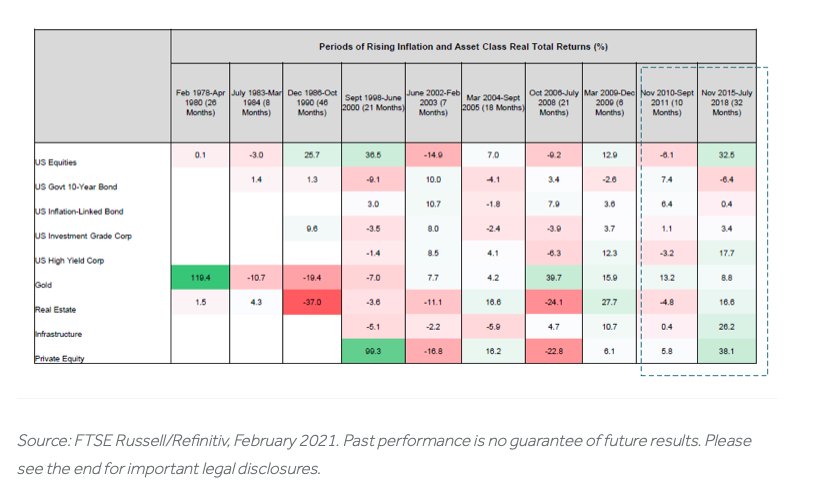
But the behaviour of assets has shown little or no consistency in inflationary periods – as Table 1 illustrates below. US equities fell back during an inflationary period in 2010/11 as markets worked out that a real income squeeze would deter the Fed from raising rates. When the Fed raised rates to combat inflation from 2015/18, equities rallied strongly due to underlying strength of the economy.
Even US TIPs – an inflation-linked asset – performed negatively during an inflationary period in 2004/2005.
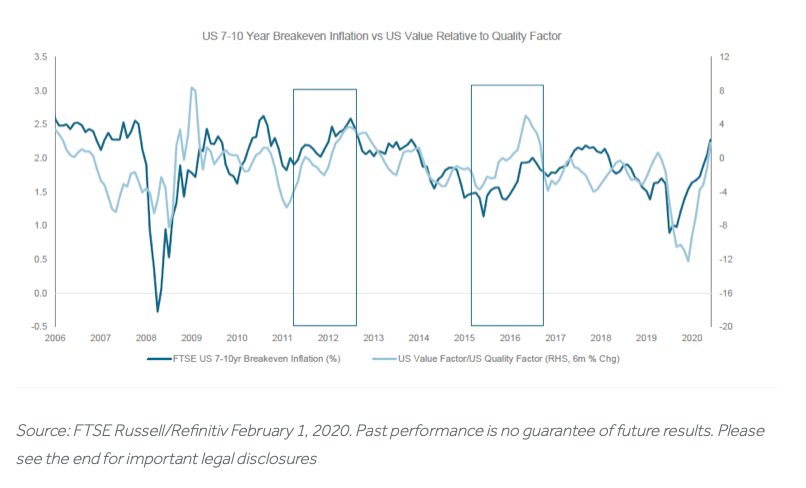
A change in inflation expectations has been a key player in the rotation between quality/growth stocks and value/cyclical stocks as shown in Chart 3 (below), where US value outperforming quality. when US 10-year breakeven inflation rose. This supports an argument that sustained inflation sees a rotation out of highly-valued stocks into cyclicals.
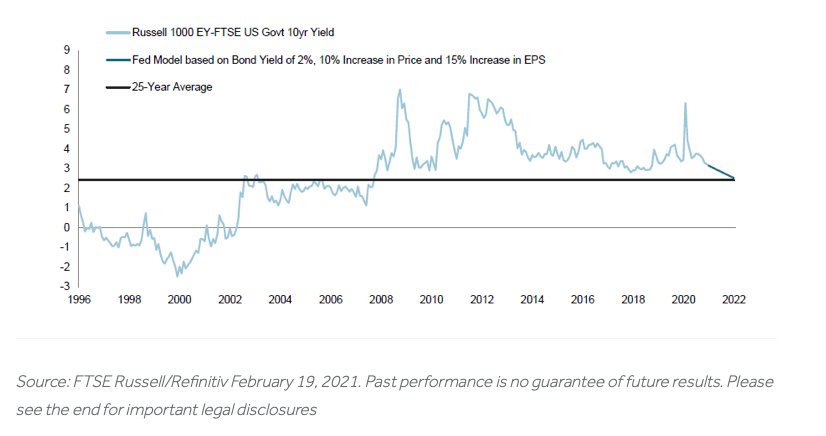
Rising bond yields amid pose a question for equity investors. But as Chart 4 shows below, using a Fed model based on historical middle-of-the-road US bond yields and equity earnings, an increase in bond yields to 2%, would move the equity risk premium 50bps lower but only back to its 25-year average level. This is some way above a point where seasoned observers would start to consider whether equities were justifying their risk. This suggests there is some slack in equity valuations to accommodate rising bond yields.
This article first appeared on March 15 on the FTSE Russell blog.
Photo Credit: Pictures of Money via Flickr Creative Commons
Disclosure
© 2021 London Stock Exchange Group plc and its applicable group undertakings (the “LSE Group”). The LSE Group includes (1) FTSE International Limited (“FTSE”), (2) Frank Russell Company (“Russell”), (3) FTSE Global Debt Capital Markets Inc. and FTSE Global Debt Capital Markets Limited (together, “FTSE Canada”), (4) MTSNext Limited (“MTSNext”), (5) Mergent, Inc. (“Mergent”), (6) FTSE Fixed Income LLC (“FTSE FI”), (7) The Yield Book Inc (“YB”) and (8) Beyond Ratings S.A.S. (“BR”). All rights reserved.
FTSE Russell® is a trading name of FTSE, Russell, FTSE Canada, MTSNext, Mergent, FTSE FI, YB and BR. “FTSE®”, “Russell®”, “FTSE Russell®”, “MTS®”, “FTSE4Good®”, “ICB®”, “Mergent®”, “The Yield Book®”, “Beyond Ratings®” and all other trademarks and service marks used herein (whether registered or unregistered) are trademarks and/or service marks owned or licensed by the applicable member of the LSE Group or their respective licensors and are owned, or used under licence, by FTSE, Russell, MTSNext, FTSE Canada, Mergent, FTSE FI, YB or BR. FTSE International Limited is authorised and regulated by the Financial Conduct Authority as a benchmark administrator.
All information is provided for information purposes only. All information and data contained in this publication is obtained by the LSE Group, from sources believed by it to be accurate and reliable. Because of the possibility of human and mechanical error as well as other factors, however, such information and data is provided “as is” without warranty of any kind. No member of the LSE Group nor their respective directors, officers, employees, partners or licensors make any claim, prediction, warranty or representation whatsoever, expressly or impliedly, either as to the accuracy, timeliness, completeness, merchantability of any information or of results to be obtained from the use of FTSE Russell products, including but not limited to indexes, data and analytics, or the fitness or suitability of the FTSE Russell products for any particular purpose to which they might be put. Any representation of historical data accessible through FTSE Russell products is provided for information purposes only and is not a reliable indicator of future performance.
The Russell 1000 Index is a stock market index that tracks the highest-ranking 1,000 stocks in the Russell 3000 Index, which represent about 90% of the total market capitalization of that index. Investors can’t invest directly into indexes.
No responsibility or liability can be accepted by any member of the LSE Group nor their respective directors, officers, employees, partners or licensors for (a) any loss or damage in whole or in part caused by, resulting from, or relating to any error (negligent or otherwise) or other circumstance involved in procuring, collecting, compiling, interpreting, analysing, editing, transcribing, transmitting, communicating or delivering any such information or data or from use of this document or links to this document or (b) any direct, indirect, special, consequential or incidental damages whatsoever, even if any member of the LSE Group is advised in advance of the possibility of such damages, resulting from the use of, or inability to use, such information.