

By An Luke Lu, Director, Yield Book Mortgage Research
Back in June, we published a blog examining how the first 100 days of the pandemic had impacted the commercial-mortgage backed securities (CMBS) market. We found that while the entire CMBS market had suffered a sharp decline at the onset of the pandemic, at the 100-day mark some real estate sectors were showing signs of recovery.
If we look at the latest numbers, we can see that while some flickers of bright spots remain, the outlook for the CMBS market has become increasingly uncertain as spikes in COVID-19 cases persist throughout the US.
After reaching a near-historic high of 10.32% in June—just shy of their July 2012 historical peak of 10.34%—CMBS 30+ day delinquency rates have dropped in July. As shown below, rates declined across all real estate sectors for the month-over-month period.
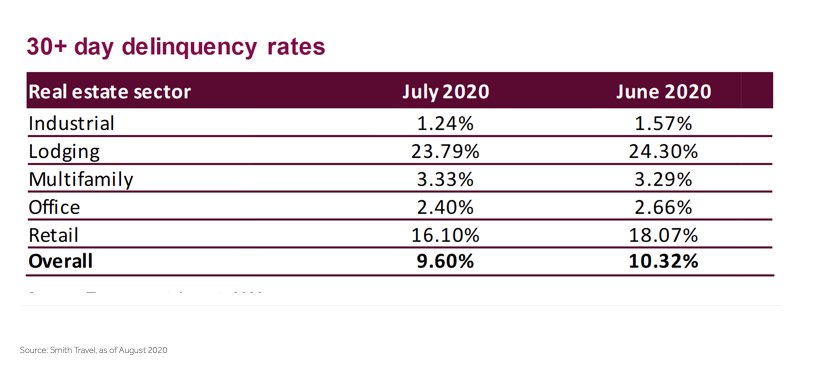
Source: Smith Travel, as of August 2020
We can attribute this improving data in large part to maturity extension, forbearance, and property cures. But while it might appear these figures point to a continued recovery, the special servicing rate—which is a future delinquency indicator—rose from 8.28% in June to 9.49% in July, driven primarily by higher hotel and retail special servicing rates.
Nonetheless, hotel data since June has been largely positive. Occupancy has continued to climb from March lows, rising week-over-week for 16 of the last 17 weeks and reaching 49.9% for the week ending August 8. However, as shown below, hotel occupancy, rates, and revenues are still well below where they were for the same week one year ago
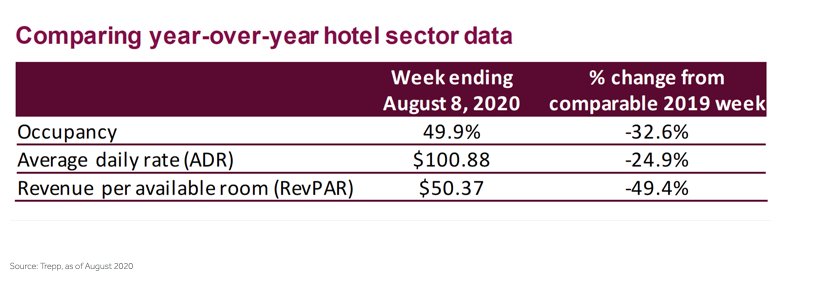
Source: Trepp, as of August 2020
While much of the improvement in hotel occupancy since March can be attributed to more people venturing out on vacations to drive-to destinations, revenue from business travel/conventions isn’t likely to return any time soon—particularly as many states have enforced strict quarantine rules for out-of-state travelers.
The multifamily sector is currently holding up well, with 93.3% of apartment households having paid rent as of July 27—only 2% lower when compared to the same period last year (based on the National Multifamily Housing Council rent payment tracker). Delinquencies, although rising, have stayed relatively low, with non-agency CMBS 30+ day delinquency at 3.33% in July. Agency multifamily is another bright spot, with GSEs actively pursuing relief measures such as forbearance for loans in trouble due to COVID-19.
Office Sector
However, with the $600 weekly unemployment boost having expired at the end of July, the multifamily sector could be poised to face significant headwinds as Congress struggles to reach an agreement on a new relief package.
Similarly, while the office sector has yet to show signs of real distress, several concerns make for an uncertain outlook. Long-term leases and diversified tenants have buoyed office sector performance throughout the pandemic, but as many office buildings continue to sit empty while employees work remotely, questions arise as to how long tenants will continue to pay rent.
And for those leases expiring in the near-term, whether or not tenants renew the lease—and if so, at what capacity and rate—also remains uncertain. A recent increase in sublease listings could signal that many leases will be renewed at a lesser capacity.
The retail sector continues to be dogged by bankruptcies and store closings, particularly in shopping malls, whose owners are finding it increasingly difficult to cover debt service.
As the pandemic has triggered paradigm shifts in consumer behavior, shoppers are increasingly taking their business online—expediting a trend already underway before the pandemic’s onset. As such, shopping malls are now facing the existential question as to whether they are destined to become obsolete.
Takeaway
All of these factors continue to reshape the CMBS market story, and the V-shaped rebound that appeared to be underway in June now looks less certain. Continued spikes in COVID-19 cases across the US, scaled back reopening plans, and a record Q2 drop in GDP have made for a deteriorating macro backdrop since June.
However, there could be relief in sight, as a new bill was recently proposed to Congress—Helping Open Properties Endeavor (HOPE) Act—to provide economic support for the commercial real estate market by assisting hotel and retail owners with their debt payments.
Whether or not this is the next chapter of the story remains to be seen, but as we enter the 6th month of the pandemic, we’ll continue to monitor how it impacts the US CMBS market.
Photo Credit: Samuel Ioannidis via Flickr Creative Commons
© 2020 London Stock Exchange Group plc and its applicable group undertakings (the “LSE Group”). The LSE Group includes (1) FTSE International Limited (“FTSE”), (2) Frank Russell Company (“Russell”), (3) FTSE Global Debt Capital Markets Inc. and FTSE Global Debt Capital Markets Limited (together, “FTSE Canada”), (4) MTSNext Limited (“MTSNext”), (5) Mergent, Inc. (“Mergent”), (6) FTSE Fixed Income LLC (“FTSE FI”), (7) The Yield Book Inc (“YB”) and (8) Beyond Ratings S.A.S. (“BR”). All rights reserved.
FTSE Russell® is a trading name of FTSE, Russell, FTSE Canada, MTSNext, Mergent, FTSE FI, YB and BR. “FTSE®”, “Russell®”, “FTSE Russell®”, “MTS®”, “FTSE4Good®”, “ICB®”, “Mergent®”, “The Yield Book®”, “Beyond Ratings®” and all other trademarks and service marks used herein (whether registered or unregistered) are trademarks and/or service marks owned or licensed by the applicable member of the LSE Group or their respective licensors and are owned, or used under licence, by FTSE, Russell, MTSNext, FTSE Canada, Mergent, FTSE FI, YB or BR. FTSE International Limited is authorised and regulated by the Financial Conduct Authority as a benchmark administrator.
All information is provided for information purposes only. All information and data contained in this publication is obtained by the LSE Group, from sources believed by it to be accurate and reliable. Because of the possibility of human and mechanical error as well as other factors, however, such information and data is provided “as is” without warranty of any kind. No member of the LSE Group nor their respective directors, officers, employees, partners or licensors make any claim, prediction, warranty or representation whatsoever, expressly or impliedly, either as to the accuracy, timeliness, completeness, merchantability of any information or of results to be obtained from the use of FTSE Russell products, including but not limited to indexes, data and analytics, or the fitness or suitability of the FTSE Russell products for any particular purpose to which they might be put. Any representation of historical data accessible through FTSE Russell products is provided for information purposes only and is not a reliable indicator of future performance.
No responsibility or liability can be accepted by any member of the LSE Group nor their respective directors, officers, employees, partners or licensors for (a) any loss or damage in whole or in part caused by, resulting from, or relating to any error (negligent or otherwise) or other circumstance involved in procuring, collecting, compiling, interpreting, analysing, editing, transcribing, transmitting, communicating or delivering any such information or data or from use of this document or links to this document or (b) any direct, indirect, special, consequential or incidental damages whatsoever, even if any member of the LSE Group is advised in advance of the possibility of such damages, resulting from the use of, or inability to use, such information.
No member of the LSE Group nor their respective directors, officers, employees, partners or licensors provide investment advice and nothing contained in this document or accessible through FTSE Russell Indexes, including statistical data and industry reports, should be taken as constituting financial or investment advice or a financial promotion.
Past performance is no guarantee of future results. Charts and graphs are provided for illustrative purposes only. Index returns shown may not represent the results of the actual trading of investable assets. Certain returns shown may reflect back-tested performance. All performance presented prior to the index inception date is back-tested performance. Back-tested performance is not actual performance, but is hypothetical. The back-test calculations are based on the same methodology that was in effect when the index was officially launched. However, back- tested data may reflect the application of the index methodology with the benefit of hindsight, and the historic calculations of an index may change from month to month based on revisions to the underlying economic data used in the calculation of the index.
This publication may contain forward-looking assessments. These are based upon a number of assumptions concerning future conditions that ultimately may prove to be inaccurate. Such forward-looking assessments are subject to risks and uncertainties and may be affected by various factors that may cause actual results to differ materially. No member of the LSE Group nor their licensors assume any duty to and do not undertake to update forward-looking assessments.
No part of this information may be reproduced, stored in a retrieval system or transmitted in any form or by any means, electronic, mechanical, photocopying, recording or otherwise, without prior written permission of the applicable member of the LSE Group. Use and distribution of the LSE Group data requires a licence from FTSE, Russell, FTSE Canada, MTSNext, Mergent, FTSE FI, YB and/or their respective licensors.


