

By Steve Sosnick, Chief Strategist at Interactive Brokers
Futures on the CBOE Volatility Index (VIX) give us a unique opportunity to see the market’s outlook for volatility assumptions over the coming months.
As you should know by now, VIX represents the market’s expectations for volatility over the next 30 days. That means that VIX futures give us a look at where traders expect the 30 day volatility to be at each future expiration.

Consider the following graph. It is a bit confusing at first glance, but there is a significant amount of information contained within. Each data point is the price (Y-axis) of the VIX future that expires on a given date (X-axis). When graphed with a line that connects those data points, we see a curve develop. The different colored lines represent snap shots of the curves taken on different dates, which allows us to compare the dynamics of the market’s anticipation for future volatility.
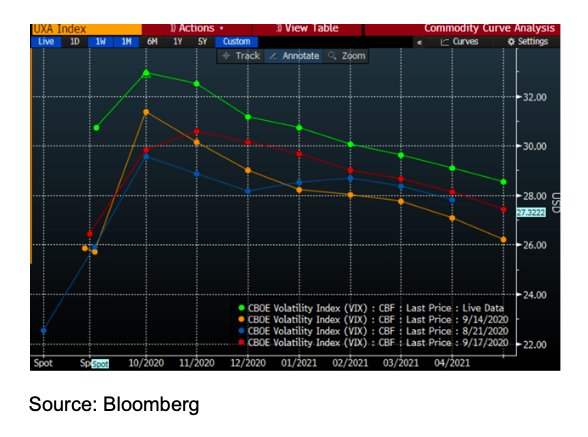
Source: Bloomberg
VIX Signals
It should be no surprise that today’s volatility assumptions (represented by the green line) would be at the top of the graph. Markets are over 2% lower as I write this, so one would expect a corresponding jump in volatility indices, especially in the spot level. That is the VIX level you see quoted when you look up the VIX index. However, we will be paying closer attention to the outer month contracts, particularly the relationship between the October and November dates.
For months we have seen a peak in the October VIX futures. That was unsurprising when one considers that the October VIX futures expire mid-month, meaning that Election Day is within the ensuing 30 day period defined by those futures. The typical pattern was for a bump in October followed by dissipation in the months that follow.
Yet late last week, as shown by the red line, we saw November futures creep above October and a parallel rise in futures into the first quarter of next year. As I wrote last Friday, this indicated that “Either investors fear that some sort of contested election is becoming increasingly likely, or that the Democrats capture the White House and Senate, causing investors to fear capital gains and corporate tax increases (or both!).
None of those are market friendly outcomes, and the VIX is displaying nervousness around the potential timing of them.” That was before we learned of the passing of Justice Ginsburg, leading to political speculation surrounding the appointment of her successor that is being manifested in the markets this morning.
Election Volatility
Some of the rise in the October contract relative to November is more likely related to today’s market action than the election though. From a hedger’s viewpoint, the spread between spot VIX and the front month contract contracted dramatically. Yes, both are at higher levels, but we went from about a 4 point spread last Thursday to about a 2 point spread today.
Market makers and other hedgers are finding it relatively cheaper to hedge their sales of near term volatility with 1 month options, so the jump in October is likely the result of hedgers rather than speculators.
Bear in mind what the current levels of VIX are telling us in real world terms. We can use the Rule of 16 to translate the annualized values of the VIX Index into daily volatility terms. The 32 level expressed by October VIX futures means that the market expects an average of 2% daily volatility over the 30 day period from mid-October through mid-November.
That is a high bar, but not necessarily unexpected in light of current market conditions and the potential for electoral uncertainty. Yet the VIX futures are implying nearly 2% daily volatility to continue into the January inauguration and beyond.
Takeaway
A consistent theme in my work has been to remind readers and viewers about making sure that their risk exposures are appropriate for their tolerances. Think of how you are feeling on a day like today. If you are net long, are you nervous about losses or taking them relatively in stride?
If the former, it is never inappropriate to lighten exposure or hedge appropriately – though hedging is much cheaper when markets are sanguine (note last month’s blue line in the graph above). If you are feeling ok today, then congratulations on investing appropriately and there may be opportunities to be sought in amidst today’s action.
Photo Credit: Zooey via Flickr Creative Commons
DISCLOSURE: INTERACTIVE BROKERS
The analysis in this material is provided for information only and is not and should not be construed as an offer to sell or the solicitation of an offer to buy any security. To the extent that this material discusses general market activity, industry or sector trends or other broad-based economic or political conditions, it should not be construed as research or investment advice. To the extent that it includes references to specific securities, commodities, currencies, or other instruments, those references do not constitute a recommendation by IBKR to buy, sell or hold such investments. This material does not and is not intended to take into account the particular financial conditions, investment objectives or requirements of individual customers. Before acting on this material, you should consider whether it is suitable for your particular circumstances and, as necessary, seek professional advice.

