By Charles Champagne, Vice President, Head of Portfolio Insights and Research Analytics, State Street Global Advisors
This post was written with contributions from Bartlomiej Szczurek, who is a Research Analyst on the SPDR Portfolio Insights and Research Analytics Team.
As clients want to fully understand the true nature of their portfolio exposures, the demand for our Portfolio Insight analysis remains steady. This service provided by SPDR ETFs offers our clients an in-depth view into their portfolios, as we analyze exposures and identify inadvertent risks in such areas as asset class, security type, sector, and duration buckets.
This service not only provides our clients with valuable insights into their portfolio allocations, but also it enables our team to draw conclusions on market trends coming from hundreds of aggregated portfolios. Our findings and observations from:
- Pre-COVID-19 — Mid-2019 to end of Quarter 1 2020 and
- Post-COVID-19 — April and May 2020
are summarized in this article. We examine the active weights of a portfolio versus the clients’ strategic benchmark and break down each sub-asset class. Our team also analyzes asset allocation positioning in pre-COVID-19 and post-COVID-19 periods.
Exchange traded funds defend the pole position
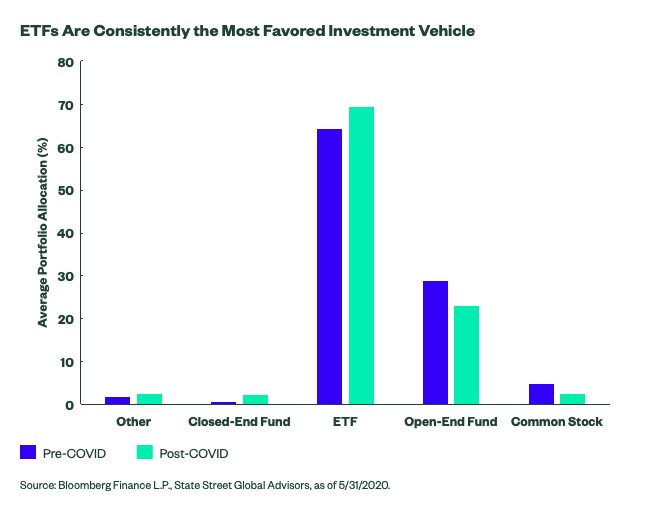
Exchange Traded Funds (ETFs) remain the most utilized investment vehicle in our clients’ portfolios, irrespective of business cycle and market condition. Throughout the pre-COVID-19 time period, the average ETF allocation within our clients’ portfolios was 64.41%, which has increased to 69.55% since the beginning of the pandemic. The analysis implies that the second-most often used vehicles were Open-End mutual funds, which made up 28.82% and 23.16% of average allocations, respectively. Almost 70% of ETF allocations were within equities, while mutual funds were used most often to acquire Fixed Income exposure, with an average allocation of 47.33%.
Our take: More investors have been turning to ETFs, particularly for their equity exposure and for reasons other than low cost, which supports their upward growth trajectory in recent years.
Equity: Defensive Positioning and Risk-off Sentiment Prevails
As the pandemic was spreading around the world, investors looked for a risk-off trade. Before the pandemic, active allocations in Equity and Fixed Income were already negative — -0.35% and -1.84%, respectively — and such trends continued as the market turmoil persisted. During the post-COVID-19 period, Equities were underweight -0.77%, while Fixed Income was -2.57% as a result of negative market sentiment. On the other side of the spectrum, there was a clear move into our Cash/Other bucket, which consists of cash/cash equivalents, Treasury bills, and commodities (consisting primarily of gold). The overweight grew from 2.20% to 3.35% in analyzed periods.
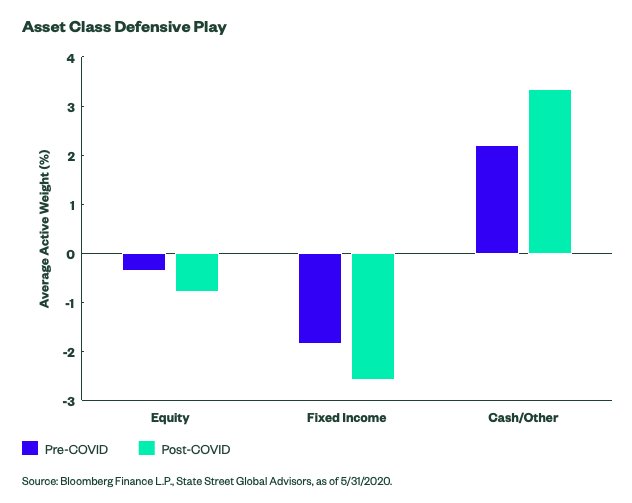
Our take: Market turmoil forces investors to reevaluate their risk profiles. Significant market uncertainty, unexpectedly high volatility and assets selloffs were drivers for investors to look for safe havens by underweighting risky assets and pile into cash holdings. Overweights in cash, T-bills and commodities (gold) might have been indications of defensive positioning as investors waited out distressed markets.
Sometimes convictions are best expressed with sectors
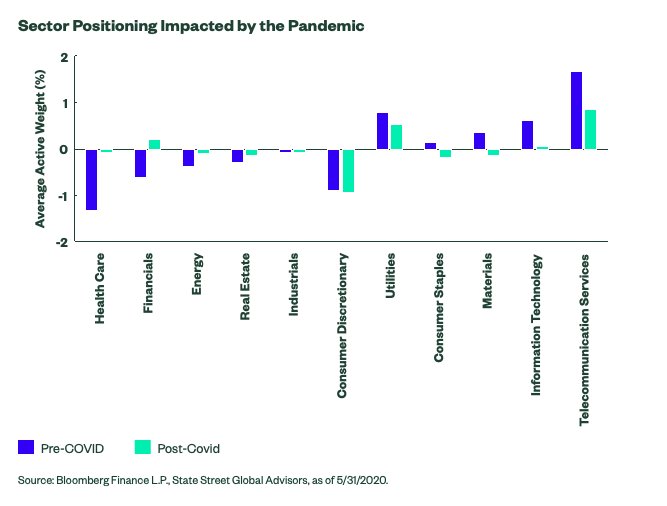
The strongest allocation conviction throughout the pre-pandemic period was in Telecommunication Services, with the average overweight relative to the clients’ strategic benchmark of 1.68%, which recently decreased to 0.85%. Client portfolios were also considerably overweight in Utilities — 0.79% — and Information Technology — 0.61%;however, the latter overweight reduced to nearly zero active allocation. The Healthcare sector was the most underweighted sector before the pandemic, but it gained the most active allocation weight in the post-COVID-19 period. In the post-COVID-19 period, investors switched the Financial sector from underweight -0.62% to overweight 0.20% and reduced underweight in Energy sectors from -0.37% to 0.1%, which signals investors’ emerging rotation into cyclicals.
Source: Bloomberg Finance L.P., State Street Global Advisors, as of 5/31/2020.
Our take: Our clients focus on the dispersion of returns and sectors’ cyclicality to determine tactical allocations and to capture trends in the market. The sector conviction during the post-COVID-19 period aligned with the overall sentiment of a market cycle. Investors upheld active allocations in Communication Services and Utilities, while at the same time, underweighting Consumer Discretionary and sharply rotating into Healthcare. All of these active allocations are signs of defensive positioning. The decrease in Information Technology active allocation is somewhat surprising, as software services were the primary means of communication during the pandemic, supporting businesses in remote work transition.
Transitioning to Regional Exposure Equality
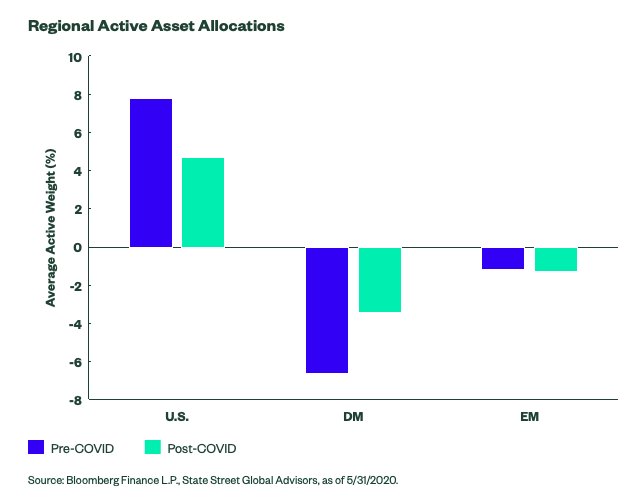
In aggregate, the portfolios analyzed before COVID-19 were significantly underweight developed market equities, with an average underweight of -6.62% relative to the clients’ strategic benchmark, while the US market was overweight 7.82%. Throughout the pandemic, the active allocation weights range was reduced by almost a half for both.
Our take: While the range of active allocations versus strategic benchmark decreased, our clients are still showing a home bias to domestic equities while potentially overlooking relative value opportunities and potential benefits of diversifying into foreign equities.
To read the entire article, please go here.
Photo Credit: Yuri Samoilov via Flickr Creative Commons
Disclosure
Commodity funds may be subject to greater volatility than investments in traditional securities. Investments in commodities may be affected by overall market movements, changes in interest rates, and other factors, such as weather, disease, embargoes, and international economic and political developments. This material is for your private information. The views expressed are the views of the SPDR® Gold Strategy Team and are subject to change based on market and other conditions. The opinions expressed may differ from those with different investment philosophies.
This material is for informational purposes only and does not constitute investment or tax advice and it should not be relied on as such. It should not be considered a solicitation to buy or an offer to sell a security. It does not take into account any investor’s particular investment objectives, strategies, tax status or investment horizon. There is no representation or warranty as to the current accuracy of, nor liability for, decisions based on such information.