

The 10 years since the great financial crisis of 2008-2009 saw global central banks unleash unprecedented monetary policy accommodation. Quantitative easing and sustained negative or very low real interest rates spurred risk appetite that has delivered overwhelmingly positive returns for equities in almost every sector and every major economy.
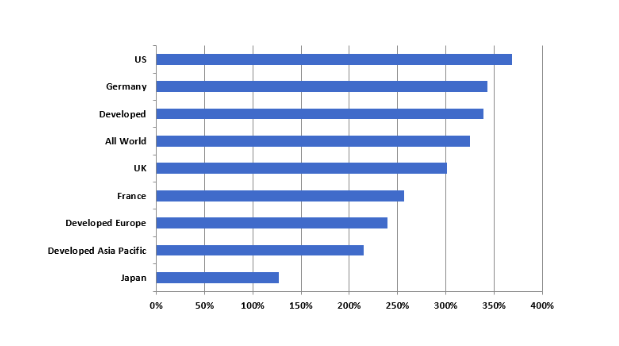
The US stands apart as the dominant performer in terms of equity returns, outperforming every comparable country, and both the FTSE Developed and All-World Indexes.
Developed market equity total returns by country in the 2010s (local currency, total return).
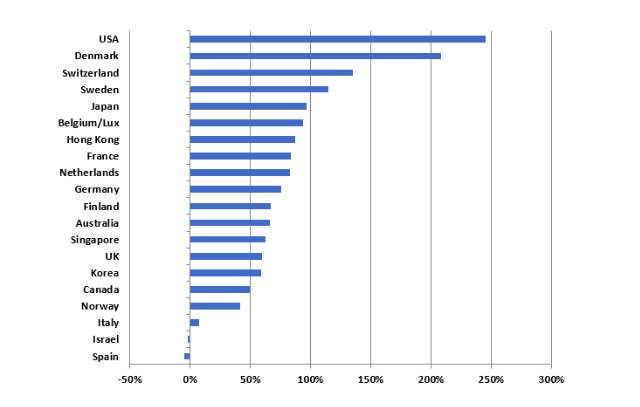
Source: FTSE Russell. Data from 12/31/09 to 12/12/19, based on the FTSE All-World Index Family. Local currency. Past performance is no guarantee of future results. Please see the end for important legal disclosures.
Developed market equity total returns by region in the 2010s (local currency, total return)
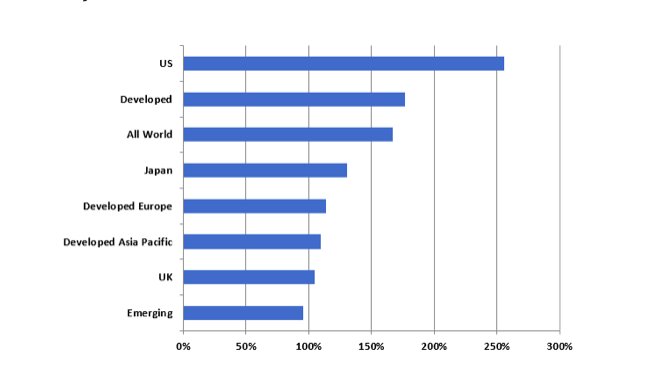
Source: FTSE Russell. Data from 12/31/09 to 12/12/19 based on the FTSE All-World Index Family. Local currency. Past performance is no guarantee of future results. Please see the end for important legal disclosures.
In EM the big winners were predominantly Asian: Taiwan, Indonesia and China.
Emerging market equity total returns by country in the 2010s (local currency, total return)
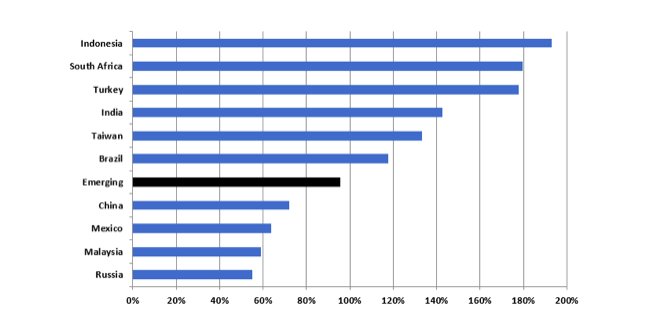
Source: FTSE Russell. Data from 12/31/09 to 12/12/19, based on the FTSE All-World Index Family. Local currency. Past performance is no guarantee of future results. Please see the end for important legal disclosures.
The US outperformance was in large part due to its technology sector weighting versus the rest of the world. Tech was by far the strongest performer in FTSE All World. (It’s hard to find a developed market equity sector that lost money in the 2010s, barring utility stocks in some European territories.)
FTSE All-World Index total return by sector in the 2010s (local currency, total return)
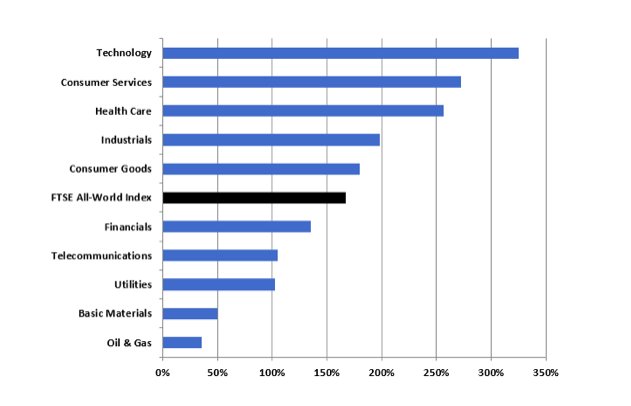
Source: FTSE Russell. Data from 12/31/09 to 12/12/19, based on the FTSE All-World Index Family. Local currency. Past performance is no guarantee of future results. Please see the end for important legal disclosures.
Total return from tech sector in the 2010s by region (local currency, total return)

Source: FTSE Russell. Data from 12/31/09 to 12/12/19, based on the FTSE All-World Index Family. Local currency. Past performance is no guarantee of future results. Please see the end for important legal disclosures.
In fixed income, longer duration (7-10 yr) government bonds delivered uniformly positive returns, and US outperformed other major markets, returning close to 60% in a decade that began with concerns about the safety of government bonds in the aftermath of the GFC.
7-10 year Government Bonds total returns from start 2010 (local currency, total return)
Source: FTSE Russell. Data from 12/31/09 to 12/12/19. Local currency. Past performance is no guarantee of future results. Please see the end for important legal disclosures.
The long-term positive performance of the major asset classes raises two big questions for investors. First, how long will the accommodative policy measures, which supercharged returns, continue? Second, if that accommodation does continue will the positive correlation between the performance of equities and bonds that has been established over the last 10 years be maintained?
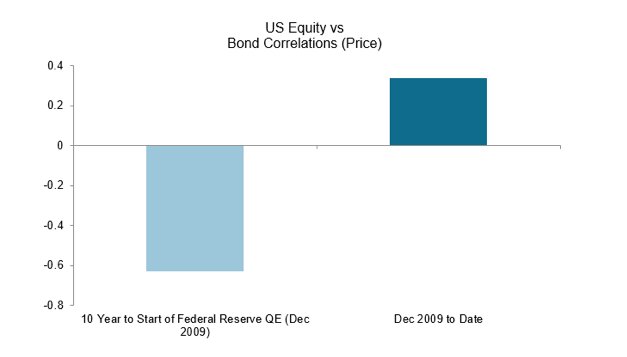
Source: FTSE Russell as at 12/17/2019. Local currency. Past performance is no guarantee of future results. Please see the end for important legal disclosures.
Sign up to our blog.
This article first appeared on January 10 on the FTSE Russell blog
Photo Credit: Magdalena Roeseler via Flickr Creative Commons
© 2020 London Stock Exchange Group plc and its applicable group undertakings (the “LSE Group”). The LSE Group includes (1) FTSE International Limited (“FTSE”), (2) Frank Russell Company (“Russell”), (3) FTSE Global Debt Capital Markets Inc. and FTSE Global Debt Capital Markets Limited (together, “FTSE Canada”), (4) MTSNext Limited (“MTSNext”), (5) Mergent, Inc. (“Mergent”), (6) FTSE Fixed Income LLC (“FTSE FI”), (7) The Yield Book Inc (“YB”) and (8) Beyond Ratings S.A.S. (“BR”). All rights reserved.
FTSE Russell® is a trading name of FTSE, Russell, FTSE Canada, MTSNext, Mergent, FTSE FI, YB and BR. “FTSE®”, “Russell®”, “FTSE Russell®”, “MTS®”, “FTSE4Good®”, “ICB®”, “Mergent®”, “The Yield Book®”, “Beyond Ratings®” and all other trademarks and service marks used herein (whether registered or unregistered) are trademarks and/or service marks owned or licensed by the applicable member of the LSE Group or their respective licensors and are owned, or used under licence, by FTSE, Russell, MTSNext, FTSE Canada, Mergent, FTSE FI, YB or BR. FTSE International Limited is authorised and regulated by the Financial Conduct Authority as a benchmark administrator.
All information is provided for information purposes only. All information and data contained in this publication is obtained by the LSE Group, from sources believed by it to be accurate and reliable. Because of the possibility of human and mechanical error as well as other factors, however, such information and data is provided “as is” without warranty of any kind. No member of the LSE Group nor their respective directors, officers, employees, partners or licensors make any claim, prediction, warranty or representation whatsoever, expressly or impliedly, either as to the accuracy, timeliness, completeness, merchantability of any information or of results to be obtained from the use of FTSE Russell products, including but not limited to indexes, data and analytics, or the fitness or suitability of the FTSE Russell products for any particular purpose to which they might be put. Any representation of historical data accessible through FTSE Russell products is provided for information purposes only and is not a reliable indicator of future performance.
No responsibility or liability can be accepted by any member of the LSE Group nor their respective directors, officers, employees, partners or licensors for (a) any loss or damage in whole or in part caused by, resulting from, or relating to any error (negligent or otherwise) or other circumstance involved in procuring, collecting, compiling, interpreting, analysing, editing, transcribing, transmitting, communicating or delivering any such information or data or from use of this document or links to this document or (b) any direct, indirect, special, consequential or incidental damages whatsoever, even if any member of the LSE Group is advised in advance of the possibility of such damages, resulting from the use of, or inability to use, such information.
No member of the LSE Group nor their respective directors, officers, employees, partners or licensors provide investment advice and nothing contained in this document or accessible through FTSE Russell Indexes, including statistical data and industry reports, should be taken as constituting financial or investment advice or a financial promotion.
Past performance is no guarantee of future results. Charts and graphs are provided for illustrative purposes only. Index returns shown may not represent the results of the actual trading of investable assets. Certain returns shown may reflect back-tested performance. All performance presented prior to the index inception date is back-tested performance. Back-tested performance is not actual performance, but is hypothetical. The back-test calculations are based on the same methodology that was in effect when the index was officially launched. However, back- tested data may reflect the application of the index methodology with the benefit of hindsight, and the historic calculations of an index may change from month to month based on revisions to the underlying economic data used in the calculation of the index.
This publication may contain forward-looking assessments. These are based upon a number of assumptions concerning future conditions that ultimately may prove to be inaccurate. Such forward-looking assessments are subject to risks and uncertainties and may be affected by various factors that may cause actual results to differ materially. No member of the LSE Group nor their licensors assume any duty to and do not undertake to update forward-looking assessments.
No part of this information may be reproduced, stored in a retrieval system or transmitted in any form or by any means, electronic, mechanical, photocopying, recording or otherwise, without prior written permission of the applicable member of the LSE Group. Use and distribution of the LSE Group data requires a licence from FTSE, Russell, FTSE Canada, MTSNext, Mergent, FTSE FI, YB and/or their respective licensors.


