

By Rolf Agather, managing director, US research at FTSE Russell
Academic research has demonstrated the existence of what is known as the “size” or “small-cap” premium beginning over 30 years ago. Today many investors take it as given that small stocks will outperform large stocks based on this foundational principle of finance.
It is a rational expectation, since small stocks are demonstrably more risky than larger stocks, so they should provide investors with additional compensation for bearing this risk in the form of extra return.
With over four decades of return history for the Russell US
Indexes we can produce a long-term analysis of the relative performance of large and small US companies using the Russell 1000 large cap index and the Russell 2000 small cap index.
Living Large
Over the last 40 years, large stocks have actually edged out small stocks by a slight margin through the end of 2018.
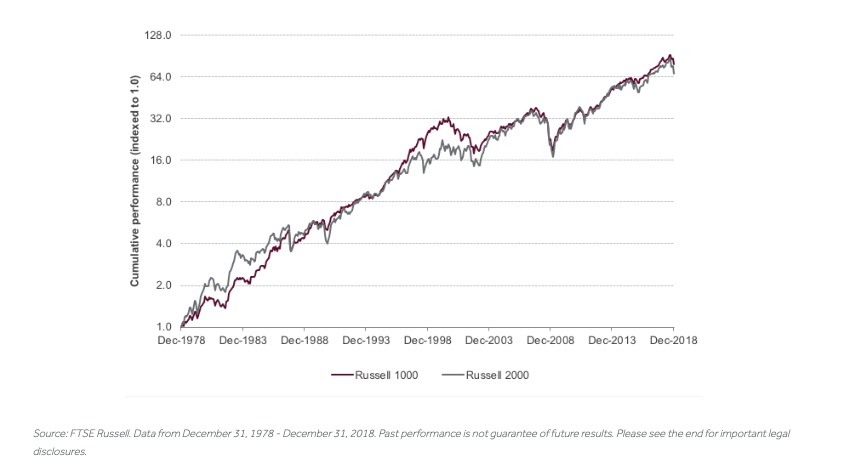
Note that any performance analysis such as this is subject to time period dependency; the results can be unique to the specific time period under consideration, and different conclusions may be reached depending on the time period chosen for the analysis.
Digging deeper into the last 40 years demonstrates how different time periods may have produced different outcomes with respect to the performance of large stocks versus small stocks.
Trading Places
For the entire 40 year period ending December 31, 2018 the Russell 1000 Index would have outperformed the Russell 2000 Index by about 0.4% (40 basis points) on average.
However, if we look at each of the successive decades within the longer period we see that this relationship is not always the same. The Russell 2000 would have outperformed the Russell 1000 in the first and third 10-year periods, and underperformed the Russell 1000 in the second and fourth 10-year period.
Does this contradict the academic evidence for the small cap premium? Not necessarily, but it does highlight that the small cap premium is not guaranteed over any specific time period. This is why academics require very long time series for research; the more observations they have, the higher their confidence in the conclusions that they may reach.
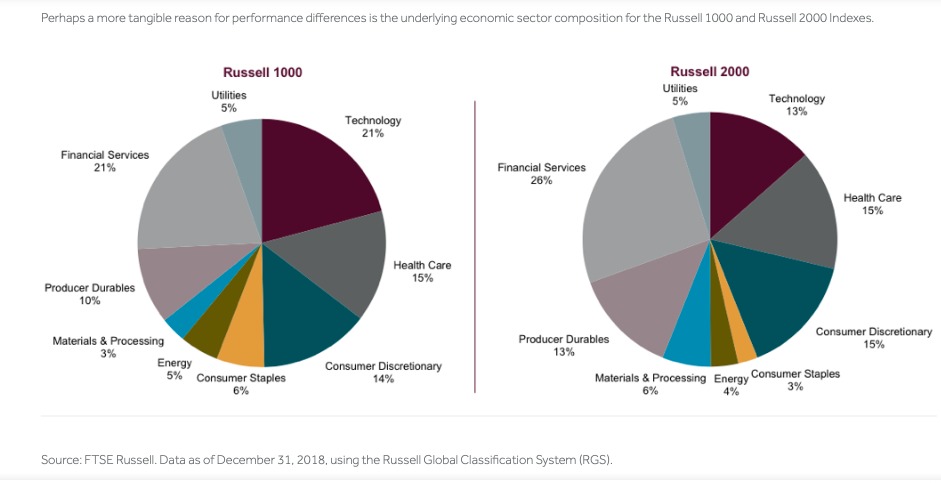
Sectors Matter
The Russell 1000 is heavily weighted in Technology, while the Russell 2000 is more heavily weighted to Financial Services. The relative performance of these sectors can drive performance differences between large and small stocks, but an even bigger driver of differences is the fact that performance for the same sector can be very different between the indexes.
Over the last 40 years, Russell 1000 Energy stocks have substantially outperformed their Russell 2000 counterparts by a multiple of over 15 to 1. This is largely driven by the fact that Russell 2000 Energy companies tend to be specialized in industries like Crude Oil Production or Oil Well Services, which have suffered with the decline of oil prices globally, whereas the Russell 1000 Energy sector is dominated by global, Integrated Oil companies, which have more diversified business models.
Similarly, large Technology sector companies within the Russell 1000 have grown dramatically relative to their Russell 2000 counterparts, and given the large weight to Technology stocks in both indexes this can frequently be a large contributor to the excess performance of the Russell 1000.
Understanding the economic underpinnings of the Russell 1000 and Russell 2000 Indexes helps investors understand what has driven the relative performance between the two indexes and is a useful analysis for assessing whether to expect a “small cap premium” in the future.
Photo Credit: Pictures of Money via Flickr Creative Commons
This article first appeared on the FTSE Russell blog on June 6.
© 2019 London Stock Exchange Group plc and its applicable group undertakings (the “LSE Group”).
All information is provided for information purposes only. All information and data contained in this publication is obtained by the LSE Group, from sources believed by it to be accurate and reliable. Because of the possibility of human and mechanical error as well as other factors, however, such information and data is provided “as is” without warranty of any kind. No member of the LSE Group nor their respective directors, officers, employees, partners or licensors make any claim, prediction, warranty or representation whatsoever, expressly or impliedly, either as to the accuracy, timeliness, completeness, merchantability of any information or of results to be obtained from the use of FTSE Russell indexes or research or the fitness or suitability of the FTSE Russell indexes or research for any particular purpose to which they might be put. Any representation of historical data accessible through FTSE Russell indexes or research is provided for information purposes only and is not a reliable indicator of future performance. No member of the LSE Group nor their respective directors, officers, employees, partners or licensors provide investment advice and nothing contained in this document or accessible through FTSE Russell Indexes, including statistical data and industry reports, should be taken as constituting financial or investment advice or a financial promotion.
No responsibility or liability can be accepted by any member of the LSE Group nor their respective directors, officers, employees, partners or licensors for (a) any loss or damage in whole or in part caused by, resulting from, or relating to any error (negligent or otherwise) or other circumstance involved in procuring, collecting, compiling, interpreting, analysing, editing, transcribing, transmitting, communicating or delivering any such information or data or from use of this blog or links to this blog or (b) any direct, indirect, special, consequential or incidental damages whatsoever, even if any member of the LSE Group is advised in advance of the possibility of such damages, resulting from the use of, or inability to use, such information.
