U.S. stocks finished the year on a strong note, as markets reacted favorably to the results of the U.S. presidential election.
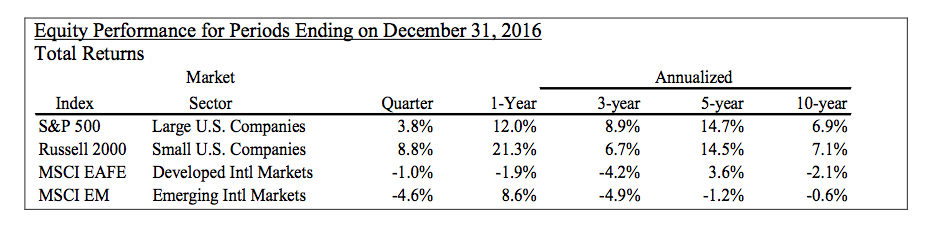
The S&P 500 and Russell 2000 indices produced total returns of 3.8% and 8.8%, respectively, for the fourth quarter as investors viewed the new administration as business friendly.

The promises of lower taxes, relaxed regulations, and increased infrastructure spending were credited with fueling the market rally.
The table below shows the performance of major equity indices for various time periods.
Black Swans
To say 2016 was a year of surprises would be an understatement in my opinion. Perhaps the biggest surprise perhaps was the election of Donald Trump as president.
From an investor’s perspective, the greatest surprise was probably the stock market’s reaction to the Trump victory. In the months prior to the election the stock market had a strong bias in favor of a Clinton victory with Republicans holding on to Congress.
This outcome represented a continuation of the status quo and held the least amount of uncertainty for the market.
Prior to the election, any news regarded as negative to the Clinton campaign raised concerns that she might not win and triggered a drop in stock prices.
Trump Bump
As election night progressed and results indicated that Trump might emerge as the winner, stock index futures dropped more than 4% overnight. However, when the market opened on the following morning stocks began to rally.
From Election Day to December 31, the S&P 500 generated returns of 5.0%, as investors embraced the incoming administration’s pro-business rhetoric.
We recognize there is a good possibility that markets have jumped to conclusions regarding changes that might or might not occur.
Even if many of Trump’s proposals are implemented, the outcomes may be different than what the market is anticipating. After all, prior to Election Day, few experts predicted a Trump victory, and even fewer thought his election would be positive for the markets.
Trade Wars
The consensus before the election was that Trump’s proposal for lower tax rates (resulting in lower tax revenues) and greater infrastructure spending would produce higher deficits.
A renegotiation of trade agreements could lead to economically damaging trade wars.
The deregulation of banking, healthcare, and energy industries might unintentionally lead to harmful consequences without delivering on their promises.
While the consensus opinion of Trump’s proposed economic policies changed overnight, it will likely be years before we see their actual impact on the economy and corporate earnings.
Winners and Losers
The table below shows the performance of various market sectors (as represented by exchange traded funds) for the period following the election to the end of the year. The table is sorted from winners to losers and provides an explanation for the performance.
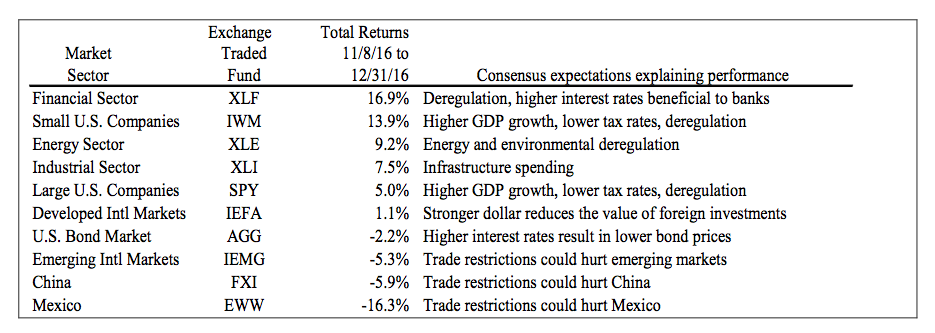
From examining the preceding table, one might conclude that tax rates have already been cut, Dodd-Frank financial regulations have been repealed, the NAFTA agreement has been dissolved, and major infrastructure projects have been approved and funded.
So far, all we have is the consensus view that these actions will occur and the outcomes will be as expected.
Unbridled Optimism
While it’s great to see the optimism associated with proposed changes, in my opinion, it is possible that the market has gotten ahead of itself in projecting future outcomes.
We really shouldn’t be surprised when predictions are wrong, whether they pertain to an election or stock market performance.
Bespoke Investment Group recently prepared an analysis of the annual forecasts of stock market strategists. The primary role of a market strategist is to predict the direction and magnitude of stock market movements.
Bespoke looked at the 17 years from 2000 to 2016 and compared the strategists’ forecasts of the upcoming end-of-year value of the S&P 500 Index with the actual results.
The strategist predicted a gain every year, while the market actually fell in five of the 17 years.
The strategists’ forecasts were wrong by an average of 13% annually and there were three years when their average forecast was wrong by more than 30%.
CEO President
As we enter a new year with a new administration, it is easy to understand the optimism.
A corporate CEO is unlikely to forecast an earnings decline for an upcoming year, just like a major league baseball manager is unlikely to predict a losing year before the season starts.
As with sports teams, corporate success will be the result of effective execution.
Historical Trend
Rather than make predictions, we prefer to provide a historical perspective on stock market performance.
Based on 89 years of historical results, the S&P 500 has generated annualized returns of 9.5%. It has produced positive returns in 73% of those years and incurred losses 27% of the time.
The average return in a positive year was 21.0% and the average loss in a negative year was 13.7%. For longer time periods, stock returns have a greater probability of positive performance.
The S&P 500 has delivered positive returns in 92% of the rolling five-year periods since 1927. You can seek to mitigate short-term stock market risk through diversification, especially by using fixed income investments, which have a low correlation with stocks.
Valuations
While we stop short of making a prediction, we view the U.S. stock market as reasonably valued.
The S&P 500 Index is currently valued at 16.9 times next 12-month estimated earnings, slightly higher than its historical average. Leading indicators point to further economic growth in 2017 for the United States and most major international economies.
The International Monetary Fund forecasts global GDP to grow at 3.4% in 2017, led by expected emerging market growth of 4.6%. U.S. GDP is expected to grow by 2.2% in 2017.
The Fed
Expectations for stronger economic growth pushed interest rates higher in the fourth quarter. The yield on the 10-year Treasury bond increased sharply from 1.61% to 2.45% during the quarter.
As expected, the Federal Reserve lifted its benchmark rate in December by 0.25% to a range of 0.50% to 0.75%. Rising interest rates resulted in losses for most bond sectors.
The Barclays Aggregate Bond Index, the broadest benchmark for the U.S. taxable bond market, lost 3.0% in the fourth quarter.
Photo Credit: Gage Skidmore via Flickr Creative Commons