Going into the new year, our models got several signals to increase cash and our S&P hedges helped us hold our ground as the market fell last month.
Going into February our positions are shifting slightly.
We’ve reduced both our cash and S&P inverse positions and added mid-term Treasuries.
Bank of Japan
These three positions are a result of the continued downtrend in the S&P 500 and the announcement last week by Japan’s central bank to implement negative interest rates.
This should attract funds from overseas into the relatively high-yielding US Treasury market.
Strategic Moves
In January, when the S&P was below 1850 we took profits due in part to our S&P Inverse positions.
These opportunities to take profits are not as hard to recognize as most might think. It goes back to basic statistics.
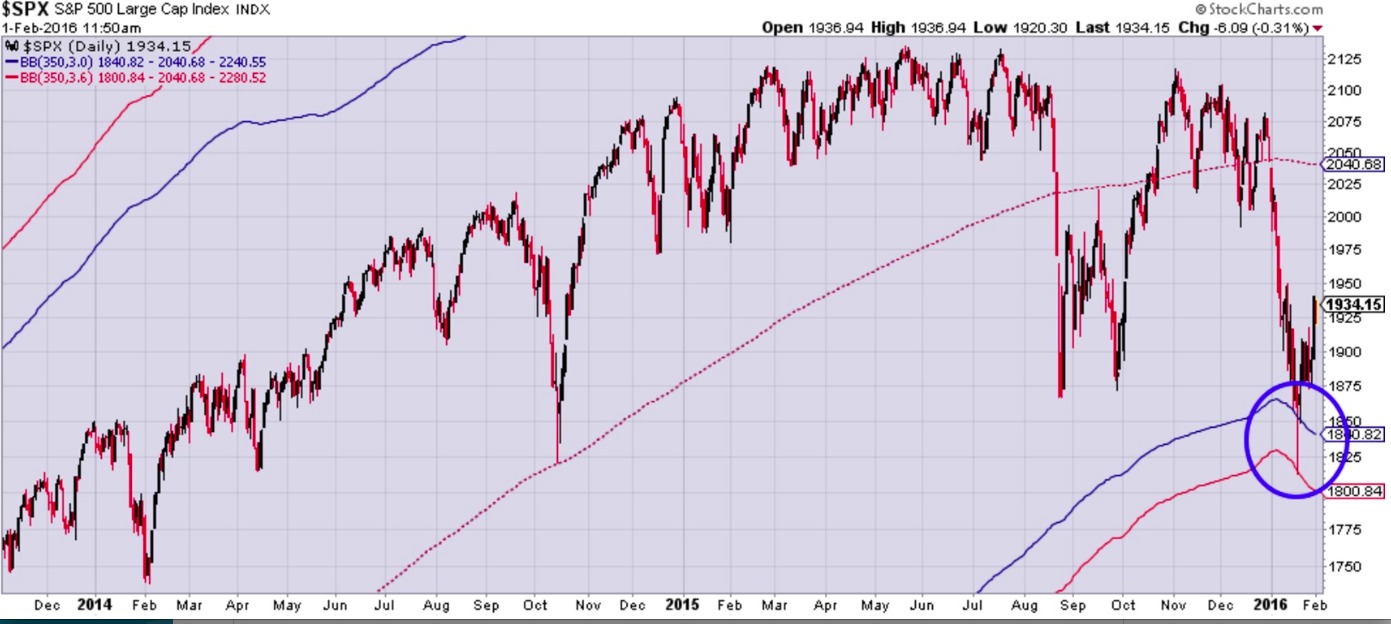
Financial markets are more prone to ‘fat tail’ or ‘black swan’ events than would be expected by a normal distribution.
However, by applying a long-term moving average and measuring 3 standard deviations below, it can help visualize when the market is at an unsustainable level.
For example, when the S&P was setting new lows on January 20th, it began to extend significantly beyond the 3rd standard deviation (blue line).
At the bottom (red line), it was about 3.6 standard deviations from the 350-day mean.
The Opportunity
This presented a great opportunity for us to cover part of our hedge because the likelihood of a short-term bounce was extremely high.
The market can and probably will move lower eventually, but it will likely take several weeks or months to allow the long-term averages to turn over before that can happen.
Next Targets
Should the S&P get back to 1960, we will add back the hedge position that we covered in January, buying back S&P Inverse (SDS).
If the market does fall further, our first target to buy is around 1700-1735. This zone shows a lot of support based on Fibonacci retracement and extension (See chart below).
Overall, even if we hit these buy targets, our net exposure to the market will continue to remain very low as long as the S&P is in a downtrend.
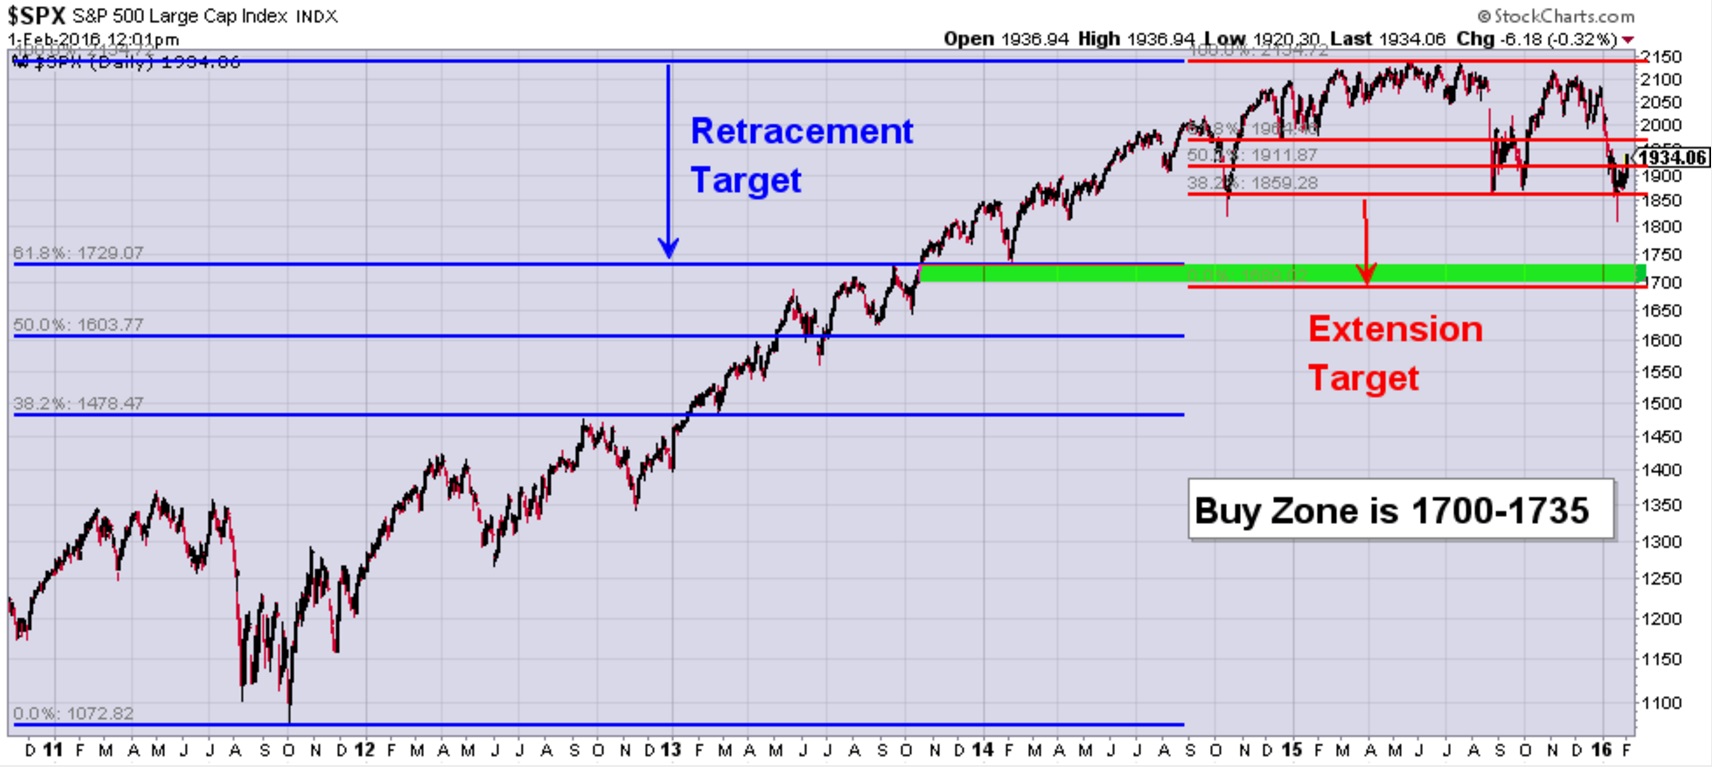
Photo Credit: NASA Goddard Space Flight Center via Flickr Creative Commons