

“The pessimist complains about the wind; the optimist expects it to change; the realist adjusts the sails.” William Arthur Ward
For the last 50 years, the S&P 500 has returned an average of 9.7% (total return) per year, fueled primarily by economic growth, corporate earnings and dividend payments.
The stock index has been positive for the last seven years and in twelve of the last thirteen calendar years. In 2015, the S&P 500 returned 1.4%, including dividends, masking a decline in the raw index of 0.8%.

While this total return was below the long-term averages, and below market expectations at the beginning of the year, it accurately mirrored the lack of growth in corporate earnings for the year.
In other words, the market performed in line with corporate earnings growth.
Time Shift
On the other hand, over the last 25 years, the S&P 500 index has suffered an average inter-year loss of 14.2%, measuring the largest market drop from a peak to a trough during the year.
The three worst losses of the S&P 500, peak to trough, were 49% (2008) and 34% (2002, 1987).
In 2015 the peak to trough loss was 12%, the worst loss in five years, but below the 25 year average. Changes in market sentiment drive most of these market losses.
Long Game
Reviewing long term history reinforces the optimist’s view that over the very long term, stocks tend to outperform inflation and every other major asset class.
On the other hand, history also reminds the pessimist that in the short run, stocks can lose more than every other major asset class.
In other words, long-term equity returns often come at the expense of jarring inter-period loss and considering history, 2015 market behavior was little different than prior history.
US Stocks
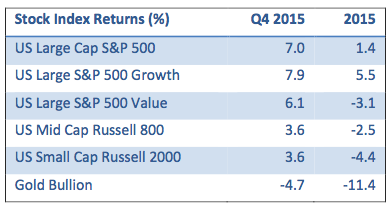
After losing 5.3% in the first three quarters of the year, the S&P 500 grew 7.0% in the fourth quarter. It ended the year up a modest 1.4%.
October was the best month of the year (up 8.4%), recovering all of the losses of August and September, but the index was off 1.6% in December, limiting year-end gains.
One of the biggest themes of the year was the narrowing leadership among stocks.
A very small group of names posted outsized gains, which helped keep the index slightly positive.
Meanwhile, the median stock in the Russell 3000 had a rough year, down more than 5%.
FANG Rules
The biggest leaders in the market such as Facebook (FB), Amazon (AMZN), Netflix (NFLX) and Google (GOOG), otherwise known as FANG, returned an average 83.2%, which contributed about 3.7% to the overall market return.
Absent FANG, the S&P 500 would have lost 2.3% for the year. Narrowing leadership is often a bear market indicator of potentially poor future performance.
Sector Analysis
Growth-oriented large cap stocks (7.9% for quarter, 5.5% for 2015) outperformed value-oriented stocks (6.1% for the quarter and minus 3.1% for the year) by 1.8% in the fourth quarter and 8.7% for the year.
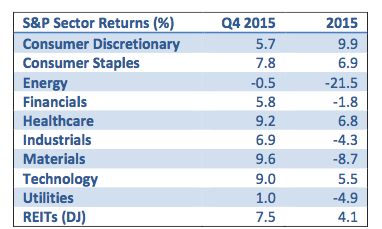
For the year, growth-oriented sectors, consumer discretionary (up 9.9%), healthcare (up 6.8%) and technology (up 5.5%) out-performed value-oriented sectors with energy (off 21.5%) and materials (minus 8.7%) being the worst performers.
Large Caps
Although large-cap stocks eked out a small gain because of dividends in 2015, the same cannot be said for mid-cap and small-cap stocks.
Mid-cap stocks, as measured by the Russell 800, while returning 3.6% for the fourth quarter, lost 2.5% for the year. Midcap growth stocks (-0.2%) outperformed mid-cap value stocks (-4.8%) by 4.6% for the year.
In the small-cap space, while the Russell 2000 won back 3.6% in the fourth quarter, small stocks lost 4.4% for the year. Small- growth stocks outperformed small-value stocks by 6.1%.
2016 Outlook
Looking forward to 2016, market consensus is for a modest, high single-digit return for the S&P 500.
Most analysts expect earnings growth to be low, ranging from 3 to 7%, contributions from dividends to be 2% and share buybacks to account for another 2% or so.
Thus, we might expect to see S&P returns to range between 7.0% and 11.0%.
However, this assumes that no material change in investor sentiment or relative valuation (price to earnings ratio) occurs.
Wild Cards
Investor sentiment is the most important factor on short term volatility.
And, in my opinion, a drop in investor sentiment is quite likely, given risk and uncertainty related to energy production, commodities pricing, overseas growth, debt levels in emerging economies, including China, and the upcoming US presidential election.
Therefore we are somewhat less optimistic than market consensus, and it is more likely-than-not that US equities will outperform fixed income in 2016 by 4% to 6% with at least one market correction of more than 10% in 2016.
Course Adjustment
Looking forward, as realists, we are adjusting our sails. Last year, the US experienced lowflation, witnessed a policy-driven rate increase in treasury rates and suffered low, positive and volatile equity market returns.
The US economy grew at a slightly better than 2.0% rate, unemployment dropped, and consumer sentiment was positive.
Low oil prices helped the gas-guzzling consumer, wages inched upwards and a new generation of smart, labor-saving devices helped to improve lifestyles and comfort.
We expect much of the same in 2016, and anticipate being surprised by rapid changes in sentiment, both positive and negative.
Keeping it Real
Overseas, we look for better growth in Europe and Japan, leading to good but not spectacular equity returns, slowing growth in China and yuan depreciation, and troubles in most emerging markets, at least in the first half of the year.
Fixed income investors should see modest total return, mostly from yield and modest loss in fixed income principal as interest rates edge slightly higher.
As realists, we know that we can’t expect to know the future, and therefore control for risk of loss through diversification, thoughtful shifts towards attractive assets in line with our investment thesis, and a hand on the tiller as we steer our portfolios through the shoals and channels ahead.
Photo Credit: Fevi in Pictures via Flickr Creative Commons


