One statistical measure that money pros watch is standard deviation. This is a measure of how much an investor or fund’s return varies to its mean or average.
This is also a useful measure of risk. It gives investors a sense of how steady a fund’s returns have been over a particular time frame.
Research firm Morningstar calculates standard deviation for the funds it tracks over a 36-month period.

In recent months, I have noticed a low three-year standard deviation for the S&P 500 Total Return Index (TR).
Recession Signal
According to my research, a recession has occurred sometime during or after every period of a low three-year standard deviation of the S&P 500 Total Return Index (TR).
In this post, I will look at what happened the four times in which a low standard of deviation running for at least three months was followed by a recession.
Risk Reading
The first table below shows the number of consecutive months the S&P 500 Total Return had a three-year standard deviation that was more than one standard deviation below the average or mean level of the market’s normal risk level.
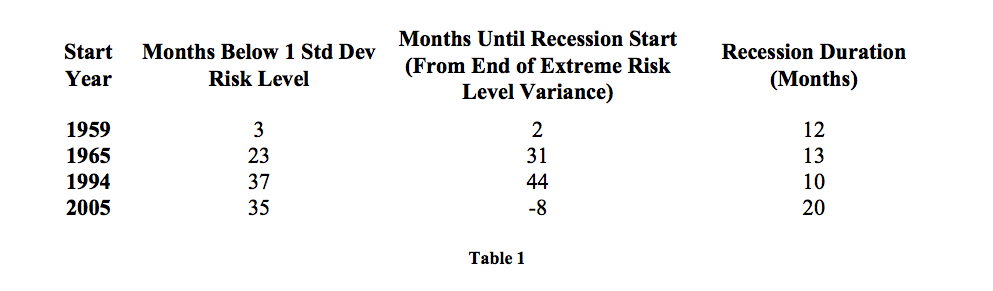
It then shows how many months, after this lower than normal market risk level, it took for a recession to start. It also shows the recessions’ duration for each period.
A cursory view of the data above suggests a potential relationship between the length of the low market risk period and the amount of time between the end of the low market risk period and the start of the recessionary period.
Best Fit
Putting the data into a graphical format and determining the “best fit” line for the data gives us the result shown in Figure 1.
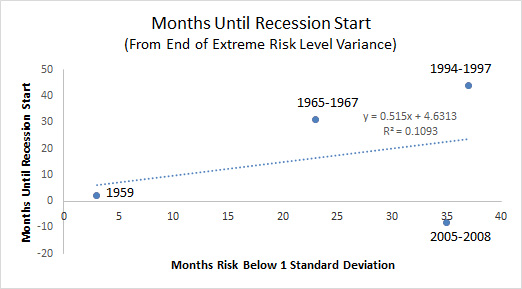
Take a look at the R squared reading, a measure of correlation between two variables. If it were above 0.50, that would suggest a correlation between the duration of the S&P 500 Total Return and the time period between the low market risk and the start of a recession.
In this case there is not much correlation between the two. However, upon closer inspection we can see that the low market risk level for the 2005-2008 time period did not abate until we were eight months into a recession.
Adjusted Data
This also appears to be an outlier in relation to the other three occurrences, so we can throw that period out and see if the resulting line and data fit better. Figure 2 shows the result.
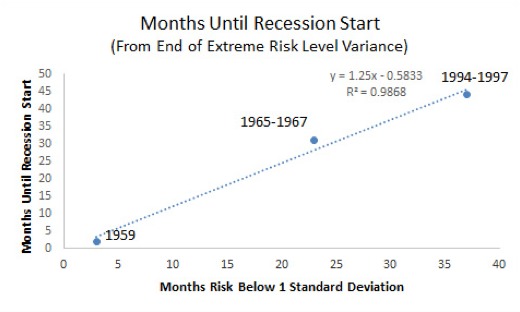
Now we have an R2 value that is worth talking about. The equation for this line is an excellent fit for the data and shows there is a strong correlation between the two variables.
Causation
Let’s take a brief aside and talk about correlation versus causation. You may be able to argue in some situations that the variable on the x-axis is a cause of the variable on the y-axis.
Oftentimes, scientists and engineers are looking for potential causes of a disease or problem. They utilize this type of tool to help them determine the likelihood that “x is a cause of y”.
However, correlation does not necessarily mean cause. Only further study can determine the cause and effect relationship.
Recession Triggers
In this case, we know that a low risk market environment is not a cause of a recession. Recessions are caused by many factors.
But it does mean that a significantly low risk market environment may be able to help us forecast when a recession may occur.
At this point we cannot predict, based on the above equation, when a recession may start. We are currently five months into this significantly low-risk market environment based on a reading of the three-year standard deviation.
In my opinion, based on my analysis of historical trends that it is possible for the recession to start prior to the market coming out of this period.
Takeaway
However, the market would need to be in this condition for at least two years, again based on my research of historical trends, before a recession is likely to start.
The market also tends to react only after we have been several months into a recession.
We had to throw out the data for 2005-2008 to come up with an equation to “predict” when a recession may occur. It also illustrates the unique situation our markets and economy finds itself today.
My post next month will show a unique way to look at the market to determine if we are due for a bear market.
Photo Credit: Jeffrey Beall via Flickr Creative Commons
DISCLAIMER: The investments discussed are held in client accounts as of March 31, 2014. These investments may or may not be currently held in client accounts. The reader should not assume that any investments identified were or will be profitable or that any investment recommendations or investment decisions we make in the future will be profitable. Past performance is no guarantee of future results.