

One of the economic trends that we think investors should focus on over the next few years is the nascent housing recovery. We believe that a normalization of the residential construction industry has the potential to surprise investors with rapid and material improvement in the economic picture of the US, from GDP and unemployment to state and Federal budgets.
In this post, Part I, we’ll discuss the recent history and current state of housing supply and demand. In Part II, we’ll investigate how foreclosures and excess housing stock affect the market and what could be the possible economic impact of a recovery.
New Housing Supply
Between 2002 and 2006, Census Bureau data show that construction began on more new housing units (e.g. single-family homes, apartment units, condos, etc.) in the US than in any other five-year period since the late 60’s. A housing bubble was underway as loose loan standards and a belief that home values could not fall led to speculative fever that nearly doubled housing prices on average nationwide. 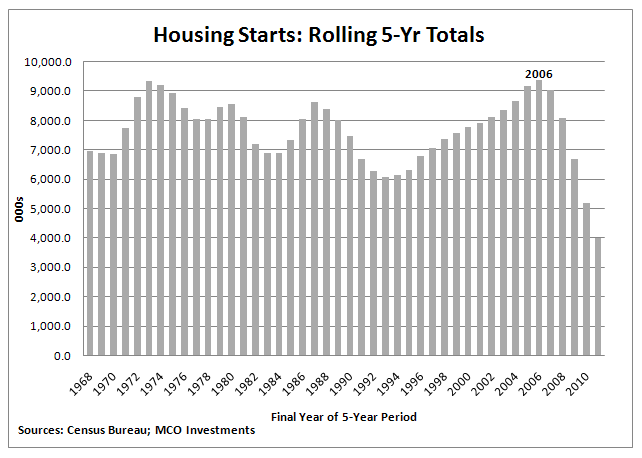
Note, however, that in contrast, the five years ending 2011 saw the fewest number of housing starts in the last 40 years. 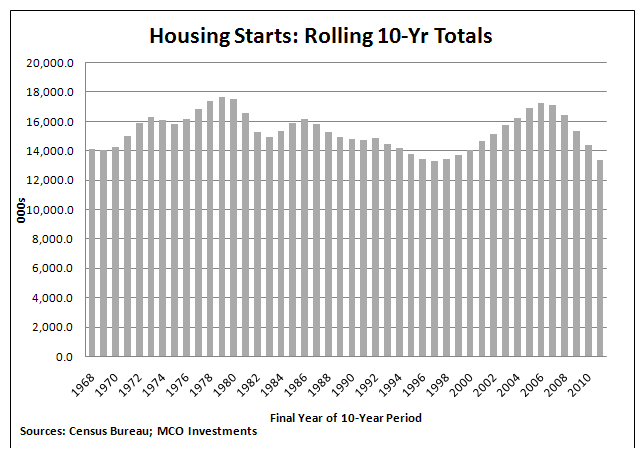
This dramatic shift in the pace of home construction leaves us asking an important question: have the last five years of anemic housing construction made up for the excesses of the bubble era?
Examining housing starts on a rolling ten-year basis shows that the decade ending in 2011 had one of the lowest totals during the period shown. In fact, only during the ten years ending 1997 did construction begin on fewer housing units. These data suggest that the excesses of the bubble have indeed been rectified, at least in terms of housing supply.
Housing Demand
But what about demand for housing? The Census Bureau defines a household as a person living alone or a group of people living together in a single home or apartment, regardless of whether they constitute an actual family. From 2001 through 2005 (the last full year that home prices consistently increased), an average of approximately 1.3M households formed in the US, just a little under the 50-year average. In contrast, during the subsequent period of 2006 through 2011, an average of approximately 600K households formed, yet the population grew at largely the same rate.
Weak household formation is most likely related to high unemployment, as people have delayed moving out of their parents’ homes, getting married, or even getting divorced until their employment situations are secure. Demand for housing appears to therefore be driving the recent low numbers of housing starts. Now that the mania of the bubble is over, homes are largely being purchased to be occupied instead of as investments to be flipped.
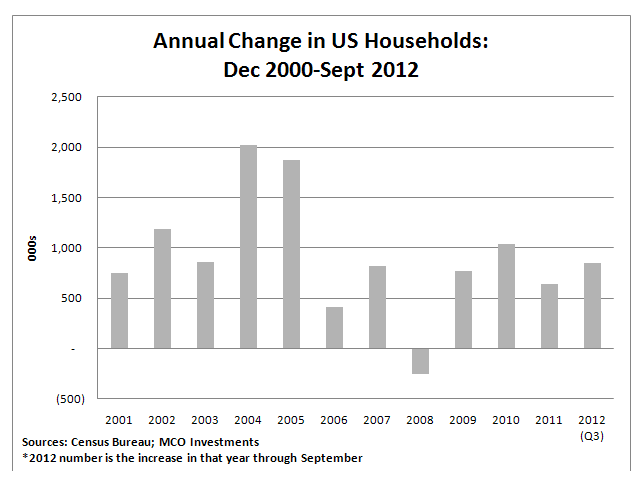
Even with an unemployment rate that remains stubbornly high, there are recent signs that household formation has begun to normalize. The Census Bureau estimates that in each month of 2012 (through September) there were about 1 million more households on average than in the same month of the previous year. This is a significant change from 2011 when the average year-over-year change was about 635 thousand, and from the previous four years when the average was approximately 550 thousand.
Household formation in 2012 is therefore approaching more normal levels, close to the historical average of about 1.3 million. Over the long-term, household formation is what drives demand for housing and for home construction. The current positive trends in household formation therefore suggest that demand for housing is starting to finally look healthy again.
Housing Market Normalization?
The data shows that a marked reduction in home construction has severely curtailed the amount of new supply coming to market over the last few years. Home builders were largely responding to changes in demand, as household formation dramatically slowed after home prices peaked. Now that households are being formed at an approximately 1 million annual run-rate in 2012, home construction is picking back up, but the annual rate implied by September’s housing starts is only 872 thousand, and construction was only started on an estimated 582.5 thousand housing units in the first three quarters of 2012.
One last point to ponder is that the Federal Reserve Bank of Cleveland estimates that there was a household shortfall of 2.6 million between 2008 and 2011. In other words, about 2.6 million households that were expected to form based on population growth failed to materialize. These “missing” households likely represent pent-up demand for housing, which begs the question (which we’ll delve deeper into in Part II) of whether the housing market could easily absorb this demand if something – like an improving economy – triggered their formation.
Certain information contained in this presentation is based upon forward-looking statements, information and opinions, including descriptions of anticipated market changes and expectations of future activity. The manager believes that such statements, information and opinions are based upon reasonable estimates and assumptions. However, forward-looking statements, information and opinions are inherently uncertain and actual events or results may differ materially from those reflected in the forward-looking statements. Therefore, undue reliance should not be placed on such forward-looking statements, information and opinions.

