By: Kevin Flanagan, Head of Fixed Income Strategy
Key Takeaways
- The UST yield curve has been inverted, but there is speculation about when it will “un” invert and move out of negative territory.
- Short-term and long-term rates do not always move in the same direction, and the magnitude of their movement affects yield curve developments.
- The potential for Fed rate cuts could impact the timing of the yield curve moving out of negative territory, with the UST 2-Year/10-Year spread potentially being the first to do so.
In my last blog post, I discussed how the inverted Treasury (UST) yield curve may have lost some of its predictive luster with respect to foreshadowing a recession, at least up to this point anyway. However, there’s another topic that I’ve been discussing in client meetings that is slowly becoming a “hot” topic, and that is the timing for when the UST curve could “un”invert, i.e., move out of negative territory.
Before I delve further, it is important to understand the dynamics behind yield curve movements. Remember, we are talking about two potentially moving parts: short-term rates and longer-term rates. Interestingly, there can be a misconception that all rates tend to move in the same direction, but history has shown us that is not necessarily the case. In addition, even if short-term and long-term rates are moving in the same direction, it is the magnitude of these movements that can dictate yield curve developments.
U.S. Treasury Yield Curves
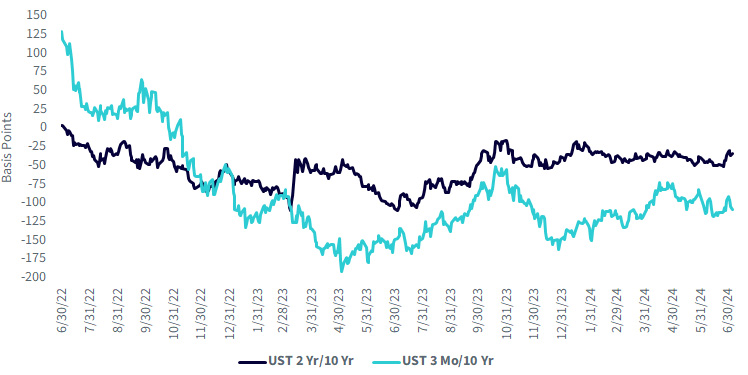
Source: Bloomberg, as of 7/2/24.
The two yield curves that are closely followed by market participants are the UST 3-Month/10-Year and UST 2-Year/10-Year differentials. These two constructs went into inverted territory during the fall and summer of 2022, respectively. In addition, the magnitude of these negative spread relationships reached historical proportions. For example, the “peak” negative reading for the UST 3-Month/10-Year relationship reached a low watermark of -190 basis points (bps), while the UST 2-Year/10-Year spread plummeted to a low of almost -110 bps, with both of these milestones occurring around the spring of 2023.
Let’s put those readings into some perspective for where things stand as of this writing. In the case of the former spread, the level is now -107 bps, while for the latter, it is -32 bps. This “steepening” has helped to bring about the very topic I am blogging about, but it should be noted that we have “seen this movie” before during the current inverted cycle.
So, what could make this time different? The potential for Fed rate cuts. In fact, that’s the underlying premise behind the discussion of when the yield curve could move out of negative territory. Let’s go back to what impacts rates along the maturity spectrum for a better understanding. Short-term yields are going to be anchored by the Fed Funds Rate, while longer-dated maturities are affected by not only monetary policy but also economic and inflation expectations and, at times, fiscal policy as well.
Given the current level of inversion for the two yield curves under discussion here, one could make the case that the UST 2-Year/10-Year spread could be the first to move out of negative territory. If the Fed cuts rates twice this year and continues into early 2025, odds would favor this differential going back to zero, or even positive, because the UST 2-Year yield would more than likely fall to, or below, the rate for the 10-Year given its tighter correlation to the Fed Funds Rate. Remember, the negative reading here is “only” -32 bps.
The timing for the UST 3-Month/10-Year “un”inversion could take longer due to the negative reading being more than one full percentage point (-107 bps). In order to reverse this negative spread, the Fed would need to be more aggressive in cutting rates than is currently expected. For instance, keeping the UST 10-Year yield where it is now at around 4.30%, technically, the Fed would need to cut rates more than four times (>100 bps total) just to get the spread back to zero.
Indeed, unless the economy—especially the labor markets—falters in a visible fashion, our reasonable case scenario sees the Fed rate cut cycle as being a more “choppy” one where easing moves are limited to 25-bp increments and do not occur at consecutive FOMC meetings. For all intents and purposes, this type of rate-cut cycle should more than likely result in yield curve steepening, but the timing could certainly be different depending on what curve you are analyzing.
Conclusion
As you can see, in the grand scheme of themes, when analyzing yield curve trends, sometimes it just comes down to the math.
This post first appeared on July 10th 2024,WisdomTree Blog
PHOTO CREDIT: https://www.shutterstock.com/g/manamana1990
Via SHUTTERSTOCK
Disclosure:
U.S. investors only: Click here to obtain a WisdomTree ETF prospectus which contains investment objectives, risks, charges, expenses, and other information; read and consider carefully before investing.
There are risks involved with investing, including possible loss of principal. Foreign investing involves currency, political and economic risk. Funds focusing on a single country, sector and/or funds that emphasize investments in smaller companies may experience greater price volatility. Investments in emerging markets, currency, fixed income and alternative investments include additional risks. Please see prospectus for discussion of risks.
Past performance is not indicative of future results. This material contains the opinions of the author, which are subject to change, and should not to be considered or interpreted as a recommendation to participate in any particular trading strategy, or deemed to be an offer or sale of any investment product and it should not be relied on as such. There is no guarantee that any strategies discussed will work under all market conditions. This material represents an assessment of the market environment at a specific time and is not intended to be a forecast of future events or a guarantee of future results. This material should not be relied upon as research or investment advice regarding any security in particular. The user of this information assumes the entire risk of any use made of the information provided herein. Neither WisdomTree nor its affiliates, nor Foreside Fund Services, LLC, or its affiliates provide tax or legal advice. Investors seeking tax or legal advice should consult their tax or legal advisor. Unless expressly stated otherwise the opinions, interpretations or findings expressed herein do not necessarily represent the views of WisdomTree or any of its affiliates.
The MSCI information may only be used for your internal use, may not be reproduced or re-disseminated in any form and may not be used as a basis for or component of any financial instruments or products or indexes. None of the MSCI information is intended to constitute investment advice or a recommendation to make (or refrain from making) any kind of investment decision and may not be relied on as such. Historical data and analysis should not be taken as an indication or guarantee of any future performance analysis, forecast or prediction. The MSCI information is provided on an “as is” basis and the user of this information assumes the entire risk of any use made of this information. MSCI, each of its affiliates and each entity involved in compiling, computing or creating any MSCI information (collectively, the “MSCI Parties”) expressly disclaims all warranties. With respect to this information, in no event shall any MSCI Party have any liability for any direct, indirect, special, incidental, punitive, consequential (including loss profits) or any other damages (www.msci.com)
Jonathan Steinberg, Jeremy Schwartz, Rick Harper, Christopher Gannatti, Bradley Krom, Kevin Flanagan, Brendan Loftus, Joseph Tenaglia, Jeff Weniger, Matt Wagner, Alejandro Saltiel, Ryan Krystopowicz, Brian Manby, and Scott Welch are registered representatives of Foreside Fund Services, LLC.
WisdomTree Funds are distributed by Foreside Fund Services, LLC, in the U.S. only.
You cannot invest directly in an index.