By: Steve Sosnick, Chief Strategist
There is an old saying that stocks take the stairs to the roof but the elevator to the basement. As with many market adages, it’s not exactly true, but there is sound behavioral logic behind it. When equity markets rally, they tend to grind higher. When they plunge, they do it quickly. At those times, fear tends to be a more visceral motivator for stock traders than greed. Yet the opposite is the case when monetary policy changes. Liquidity injections quickly boost the stock market, while restrictive policies can take months to work their way into valuations. Greed outweighs fear in that case. Let’s examine why.
The key factor is the elusive concept of momentum. From the perspective of basic physics, momentum is defined as p=mv; momentum (p) is the product of mass times velocity. Momentum plays a key role in Newton’s Second Law of Motion, which states: “when a body is acted upon by a force, the time rate of change of its momentum equals the force.” Unfortunately, the market’s definition of momentum is not as neat as a physicist’s.
It is quite clear that when market forces are greater, so is the speed of the ensuing move. But in common investment parlance, momentum is generally conflated with trendiness. I assert that momentum has more in common with Newton’s First Law, which expresses the principle of inertia as: “A body remains at rest, or in motion at a constant speed in a straight line, unless acted upon by a force.” Quite frankly it is much more exciting to discuss market trends as being a product of momentum rather than inertia. How many investors would prefer to label their trend following strategies as inertia-based, rather than momentum-based?
Regardless of terminology – momentum or inertia – we know that markets and economies tend to trend in one direction or another for periods of time. The relative persistence of those trends, and the forces required to alter their course, are the crux of the differences in policy reactions.
We have all heard that monetary policy operates with “long and variable lags.” Unfortunately, there is little consensus on how long and variable those lags may be. It can take months, if not years, for central bankers to tamp down inflationary expectations. Once they become embedded into either the public’s psyche and/or baked into contracts that adjust with changes in CPI, inflationary expectations become difficult to dislodge.
Even though inflation is at root a monetary phenomenon – too much money chasing too few goods and services – it has an important psychological component. The tools at a central bank’s disposal – interest rates and quantitative easing/tightening – have at best an indirect effect on psychology. Tighter credit eventually works its way through the economy, but only after it takes its toll on interest rate sensitive sectors and the availability of credit. Eventually those take their toll on corporate earnings, employment, and psychology – but over the course of the “long and variable lag.”
On the other hand, markets are innately attuned to positive changes in monetary supply. Consider the following two graphs. The first shows the size of the Federal Reserve’s balance sheet and the value of securities that it holds. We see that both grew sharply in rough lockstep during the post-Covid response, and until March, both began to fall as quantitative tightening (QT) replaced quantitative easing:
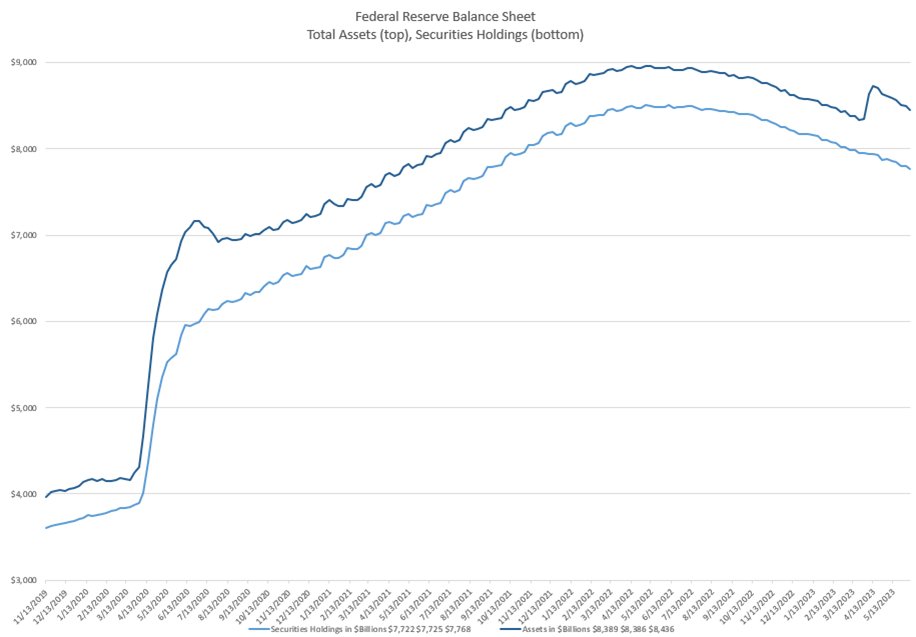
Source: Federal Reserve H.4.1 reports, Interactive Brokers
The bump in March occurred as the result of the Fed’s actions in response to the sequential banking collapses that we saw at that time. The Fed lent about $300 billion to various banks to shore up the system and those loans show up as assets on the Fed’s balance sheet. By stemming the crisis, they restored confidence to a suddenly fragile banking system – no complaints about that – but the balance sheet expansion provided a bit of a sugar rush to equites.
The following chart shows the performance of the S&P 500 Index (SPX) over the past six months. The dip in early March shows how quickly stocks respond negatively to a potential crisis. The rebound was quick and sensible when it became apparent that the contagion was limited, largely thanks to the monetary backstop.
SPX 6-Month Chart, Daily Bars
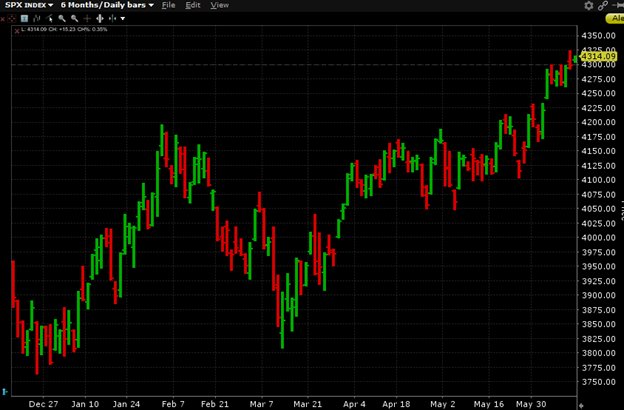
Source: Interactive Brokers
One can assert, however, that the subsequent rally, however, can be a testament to the positive momentum that the brief financial accommodation engendered and to the asymmetry of markets’ responses to changes in monetary policy. Even though the Fed’s balance sheet has shrunken to pre-crisis levels, stocks have certainly not.
We all know the importance of another key market adage – “don’t fight the Fed.” But the speed at which a Fed move inspires fight or flight depends almost entirely upon the type of monetary policy that we face. If it’s accommodative – even in response to a crisis – the response tends to be quick and thorough. If it’s restrictive, the lags tend to be long and variable.
This post first appeared on June 12th, 2023 on the IBKR Trader’s Insight blog
PHOTO CREDIT: https://www.shutterstock.com/g/Rudzhan
Via SHUTTERSTOCK
DISCLOSURE: INTERACTIVE BROKERS
The analysis in this material is provided for information only and is not and should not be construed as an offer to sell or the solicitation of an offer to buy any security. To the extent that this material discusses general market activity, industry or sector trends or other broad-based economic or political conditions, it should not be construed as research or investment advice. To the extent that it includes references to specific securities, commodities, currencies, or other instruments, those references do not constitute a recommendation by IBKR to buy, sell or hold such investments. This material does not and is not intended to take into account the particular financial conditions, investment objectives or requirements of individual customers. Before acting on this material, you should consider whether it is suitable for your particular circumstances and, as necessary, seek professional advice.
The views and opinions expressed herein are those of the author and do not necessarily reflect the views of Interactive Brokers LLC, its affiliates, or its employees.
Any trading symbols displayed are for illustrative purposes only and are not intended to portray recommendations.
In accordance with EU regulation: The statements in this document shall not be considered as an objective or independent explanation of the matters. Please note that this document (a) has not been prepared in accordance with legal requirements designed to promote the independence of investment research, and (b) is not subject to any prohibition on dealing ahead of the dissemination or publication of investment research.